

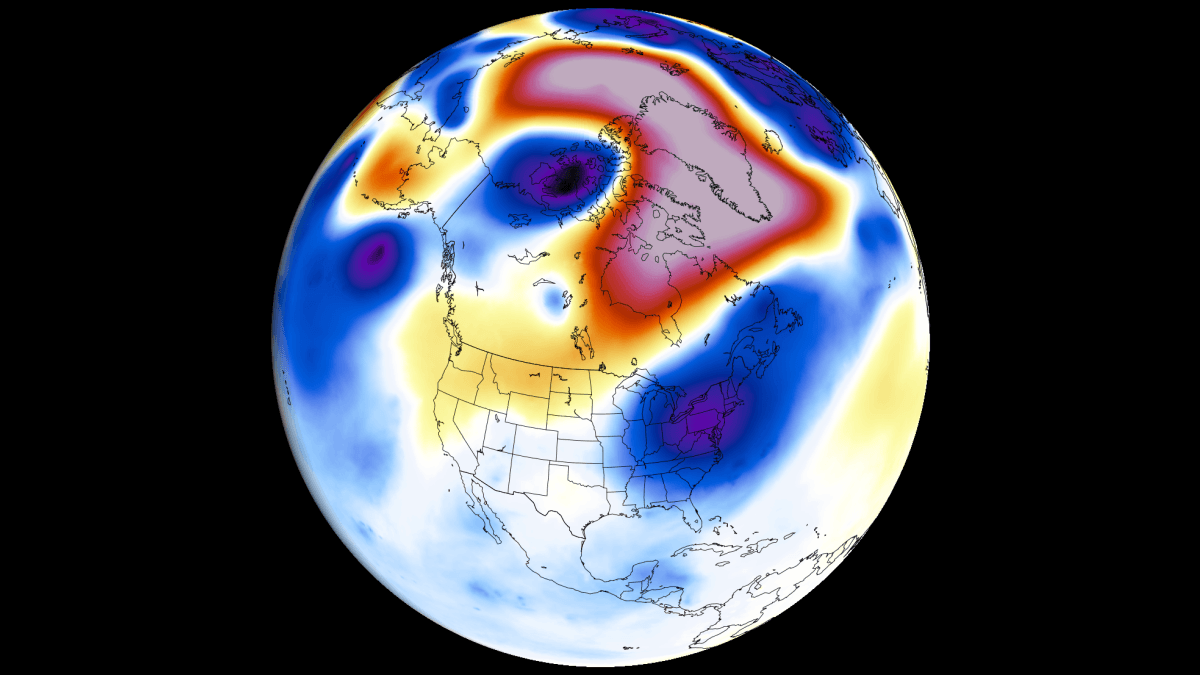
A powerful Super El Niño is showing rapid development across the tropical Pacific, with increasingly visible atmospheric impacts. The latest ocean analysis and forecast data show the event moving toward potential record intensity in late Fall and early Winter, with a broad circulation response already emerging in the atmosphere.
July has already produced pressure and temperature patterns across the United States and Canada that closely match past strong El Niño events. The August forecast now reveals the next phase of development, as increasing Pacific forcing begins to reshape the jet stream, growing its influence into Fall and Winter.
In this specialized forecast article, I first break down the latest ocean analysis and forecast data, along with the August trends for the United States, Canada, and Europe. Then, you will see how the rapidly growing Super El Niño is projected to trigger an amplified split-flow pattern moving from late Summer into Fall and Winter.
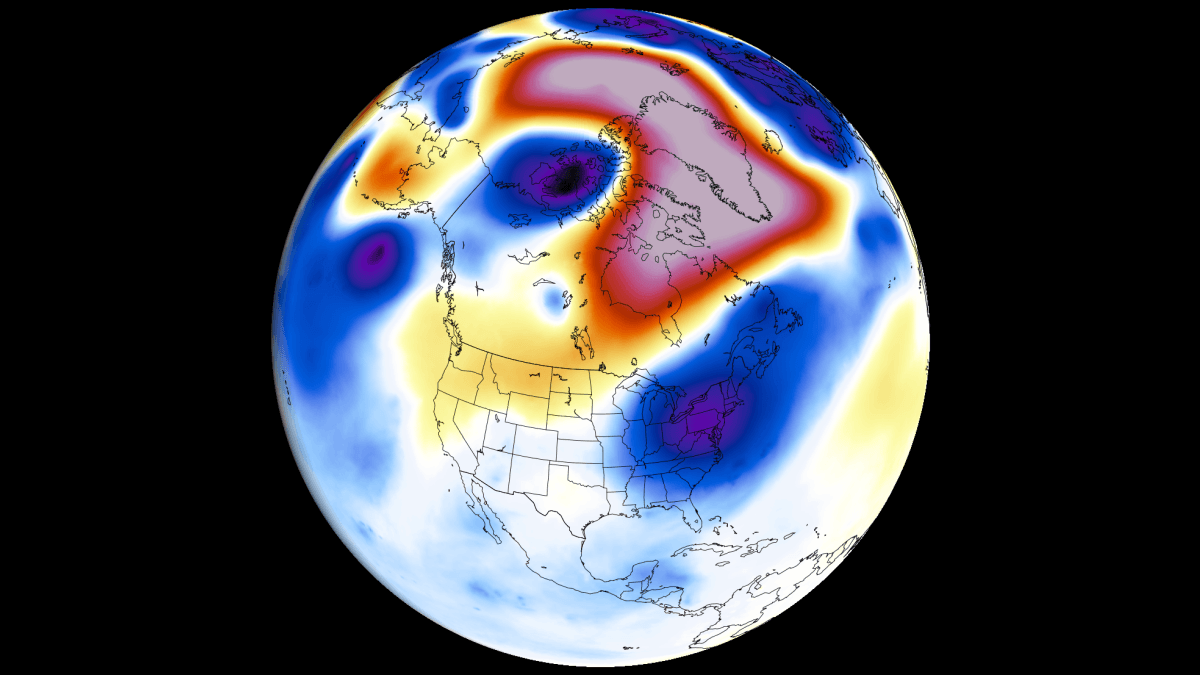
Pacific Dynamics: Super El Niño Accelerates Toward Record Intensity
Current analysis and forecast data confirm that the growing El Niño in the Pacific will be a major weather driver in 2026/2027. This is a warm temperature anomaly in the equatorial Pacific Ocean surface, creating major changes in global pressure and wind patterns.
Below, you can see the usual changes an El Niño makes to the upward and downward atmospheric motion in the tropical regions, called a Walker Cell, which is especially sensitive to strong ENSO events. It also shows the change in atmospheric motion during a moderate versus a strong El Niño event, impacting the global weather system in this strong atmospheric bridge.
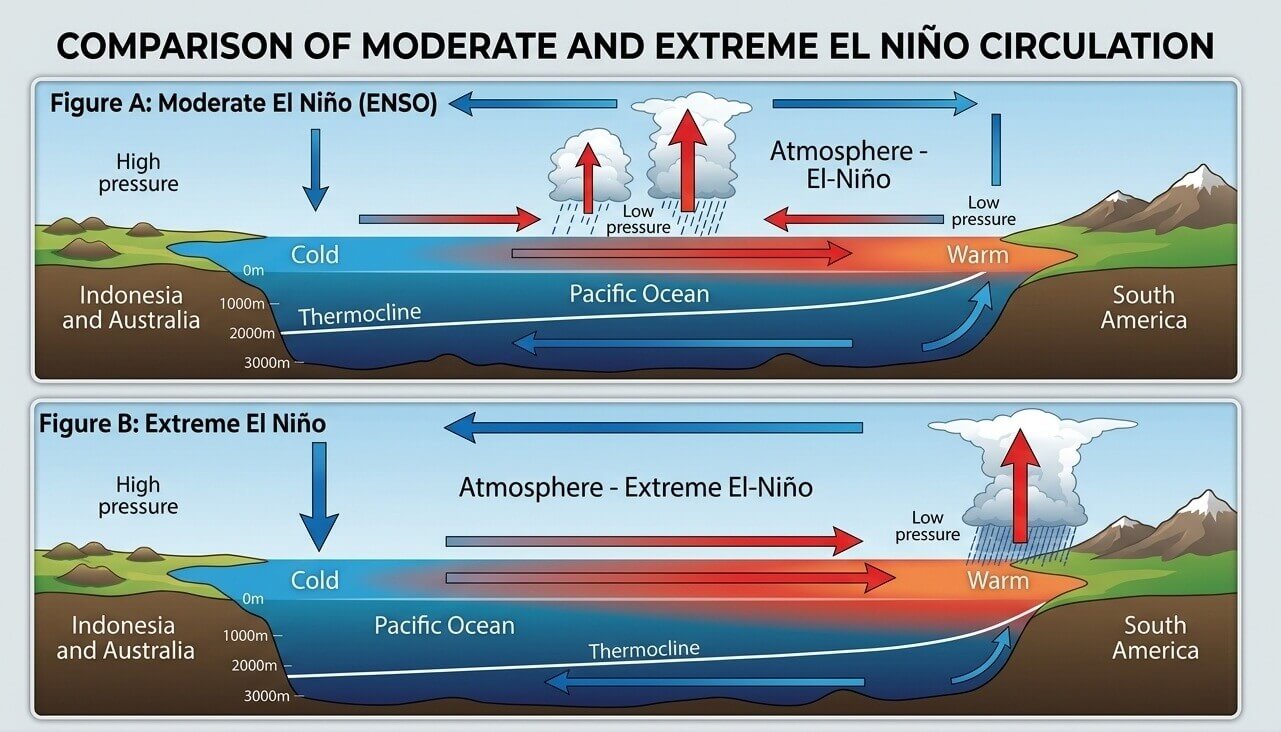
A strong or extreme El Niño causes a pressure drop in the central and eastern tropical Pacific and a high-pressure zone over the western Pacific. This has a major influence on the tropical rainfall and pressure patterns, filtering into the mid-latitudes and the global weather system.
We are currently observing a Super El Niño event developing, forecast to peak as one of the strongest such events in recorded history.
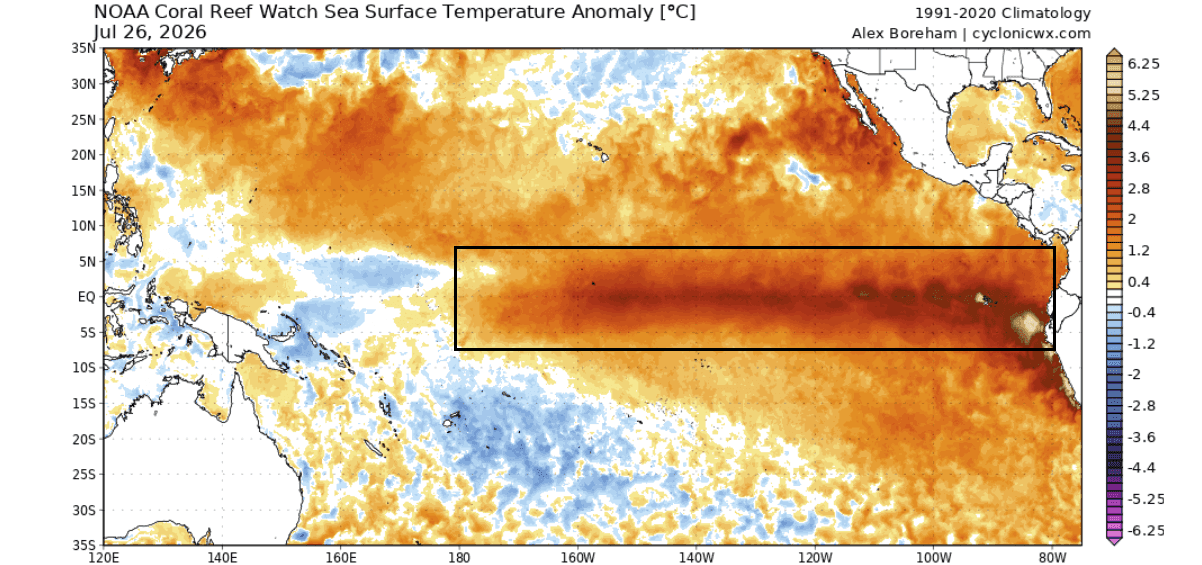
The latest ocean analysis below shows a significant warm anomaly already emerging in the main ENSO regions, with peak anomalies reaching or exceeding +5 degrees above normal. As expected, the El Niño events usually show a stronger anomaly in the eastern parts, but this event is developing unusually rapidly compared with past Super El Niño events in the available records.
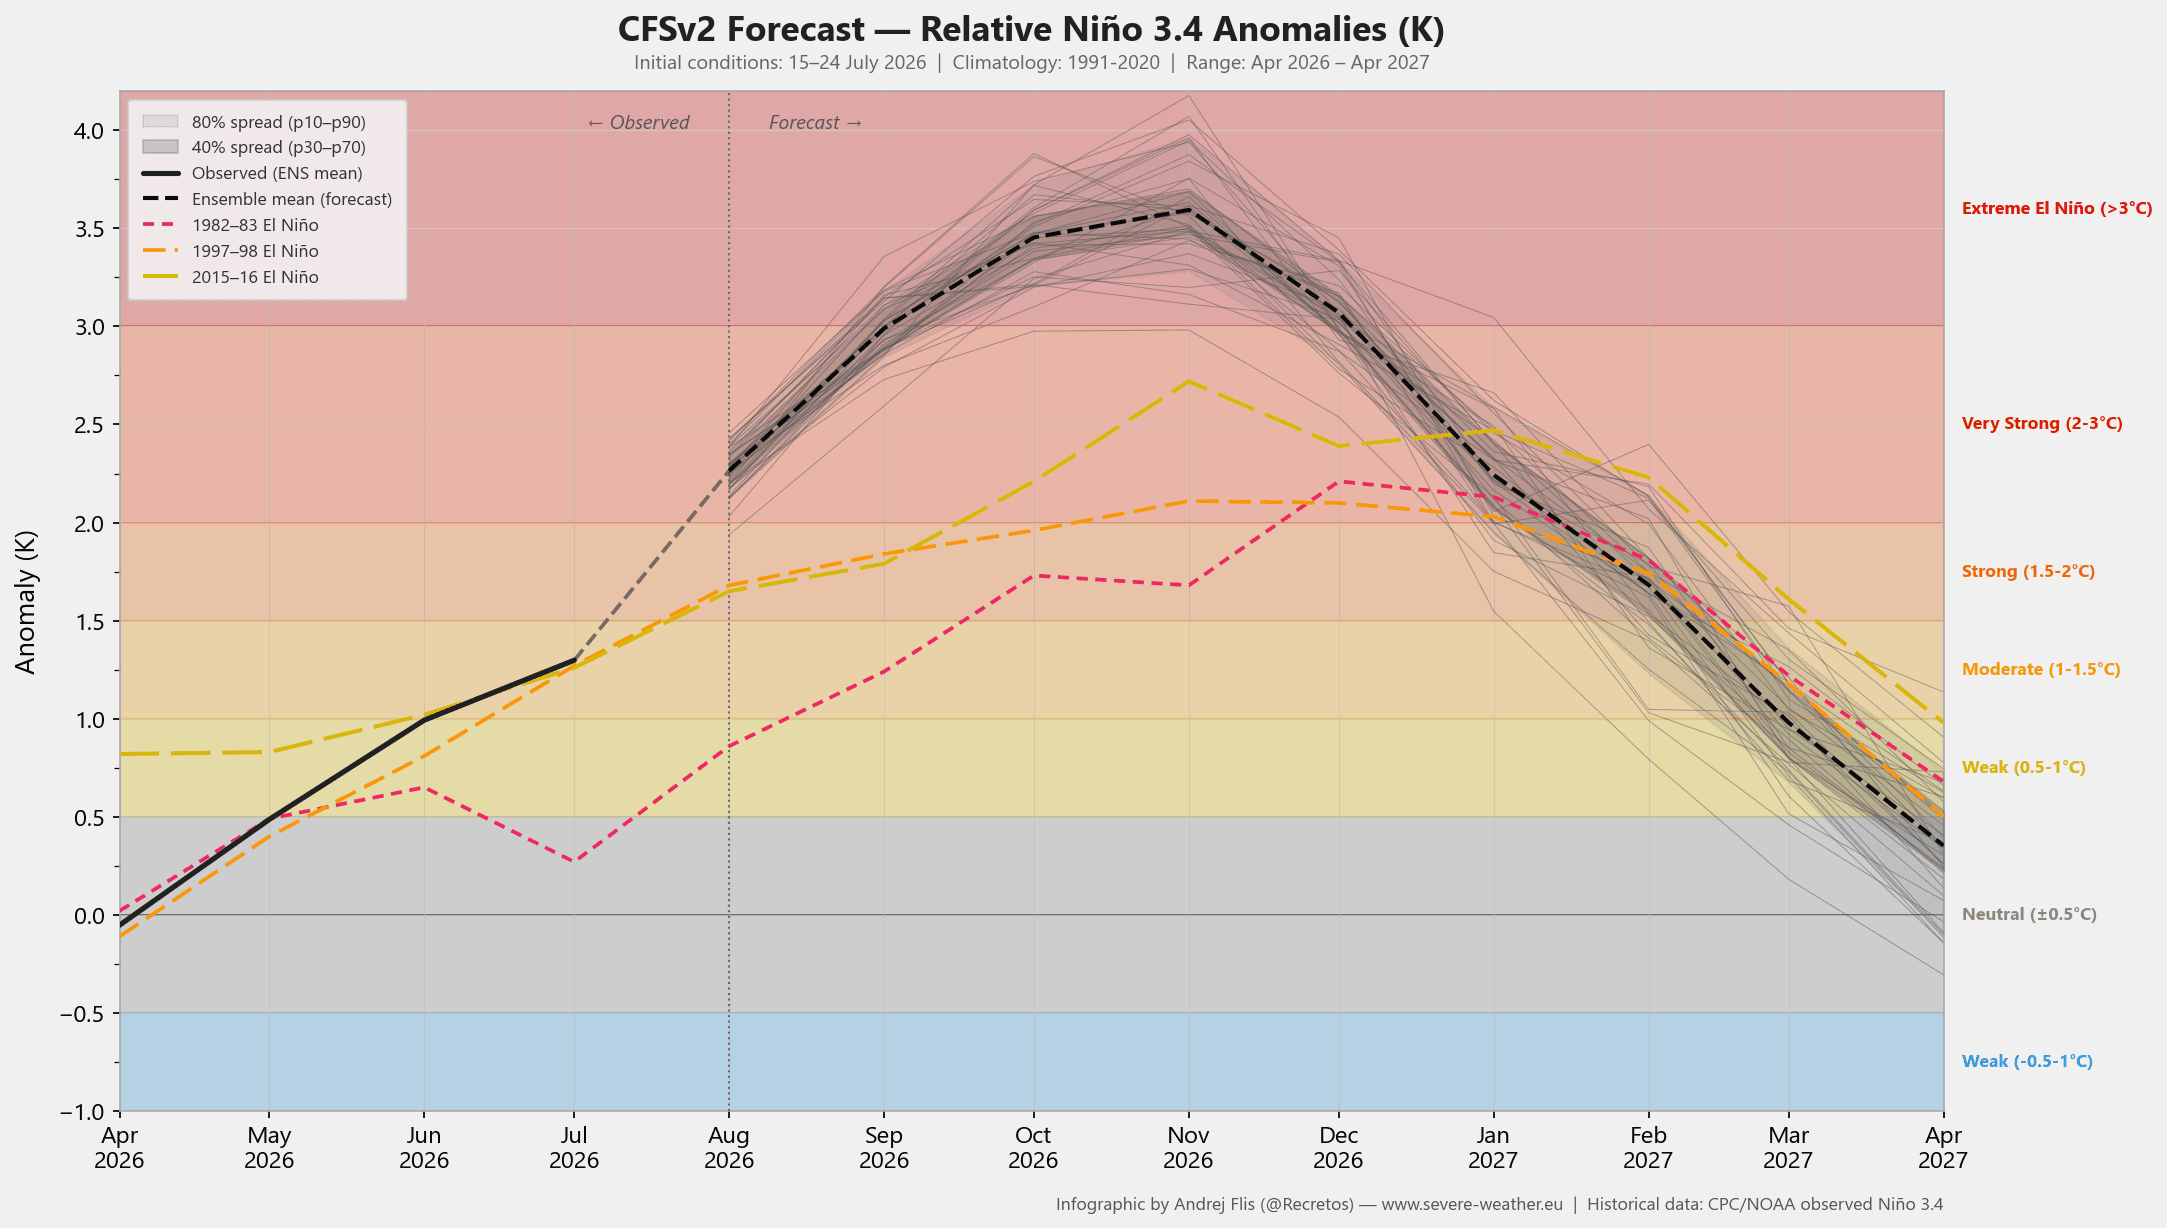
This is also visible in the latest ENSO forecast from the NCEP CFSv2 model. It shows an El Niño forecast to reach extreme levels, exceeding the Super El Niño threshold (+2 degrees), and going beyond a +3 degree anomaly. This has an immediate impact on the summer, fall, and winter patterns. The current 2026 development is on an even stronger trajectory than the last Super El Niño events, and would be record-strong if verified.
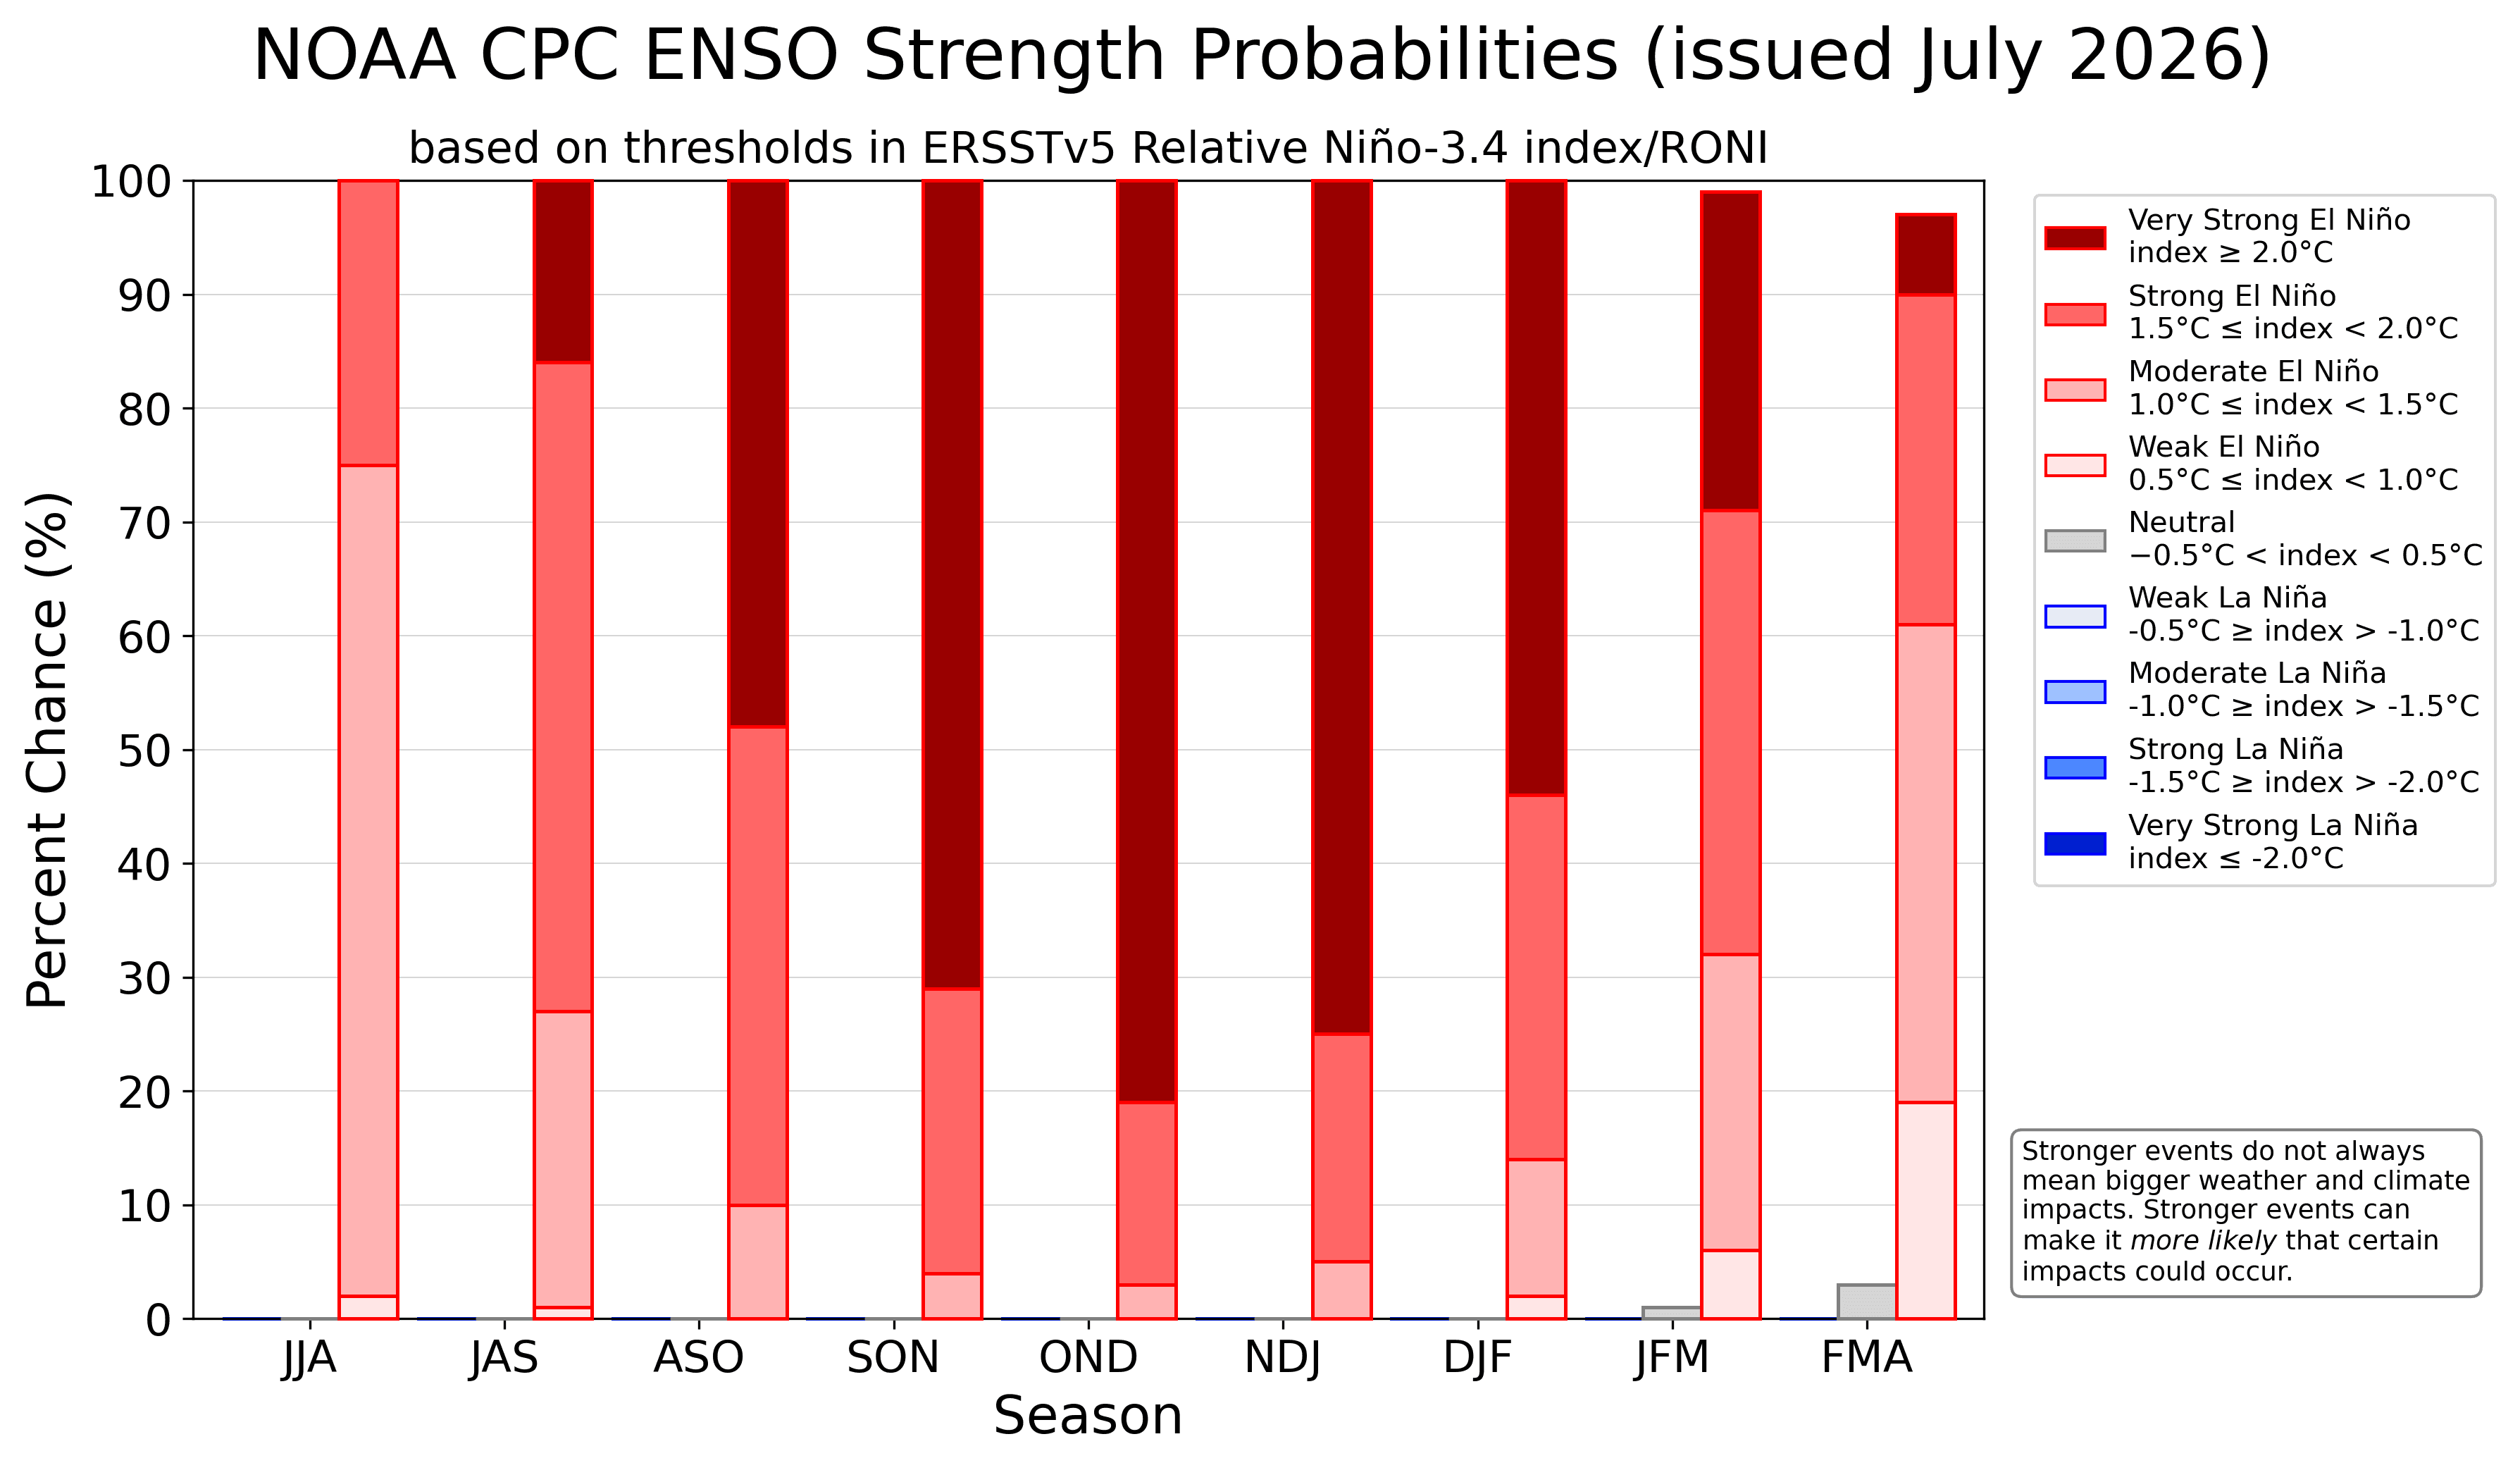
Below is also the official NOAA CPC strength probability, which shows a high likelihood for a very strong El Niño event, peaking in late Fall and early Winter. You can see substantial ensemble support for this event to end in the extreme El Niño category, exceeding the very strong level at its peak, based on the available data and current development trend.
But Super El Niño events don’t just occur out of nowhere. Westerly wind events have helped develop an unusually large subsurface warm anomaly, called a Kelvin Wave. This wave rises from below, now visible as a warm anomaly on the ocean surface that we call the El Niño.
I produced a video below that shows the past weeks of subsurface temperature anomalies in the region. It shows clear movement of this powerful Kelvin Wave and its eventual rise as a Super El Niño.
A Super El Niño event leads to more extreme weather shifts, amplifying seasonal changes with high-impact weather events, and significantly altering the location and strength of pressure systems. I am already observing this in the current weather patterns.
Atmospheric Bridge: Global Circulation Under El Niño Control
July is now ending, and this month has already shown a clear pattern that matches the past Super El Niño July anomalies. This is best seen in the analysis for North America, since it is close to the ENSO regions, under a more direct impact. But Europe usually lags behind, with other factors added to the El Niño signal.
Below is the July pressure pattern in Super El Niño years, where the main low-pressure area over North America is farther to the west. This allows a warm southerly flow to build under a high-pressure ridge across the central and eastern United States and Canada. At the same time, a cooler flow is over the west coast.
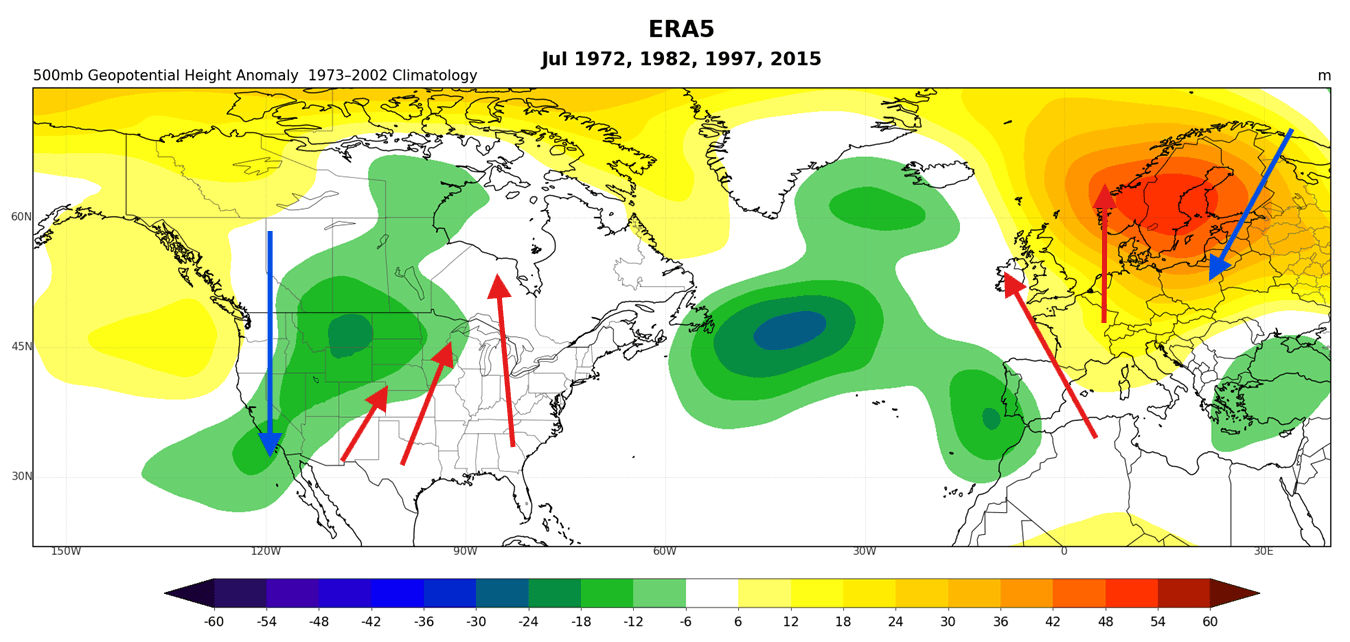
A strong high-pressure blocking anomaly is visible over northern Europe. This pattern amplifies heat over the western half, while keeping it milder in the eastern and northeastern parts.
Below is the temperature analysis for July so far, which reveals a strong anomaly pattern. It is very close to the Super El Niño Julys above, with a cooler northwesterly flow over the west coast of the United States and Canada, and a strong warm anomaly over the United States and south-central and northern Canada.
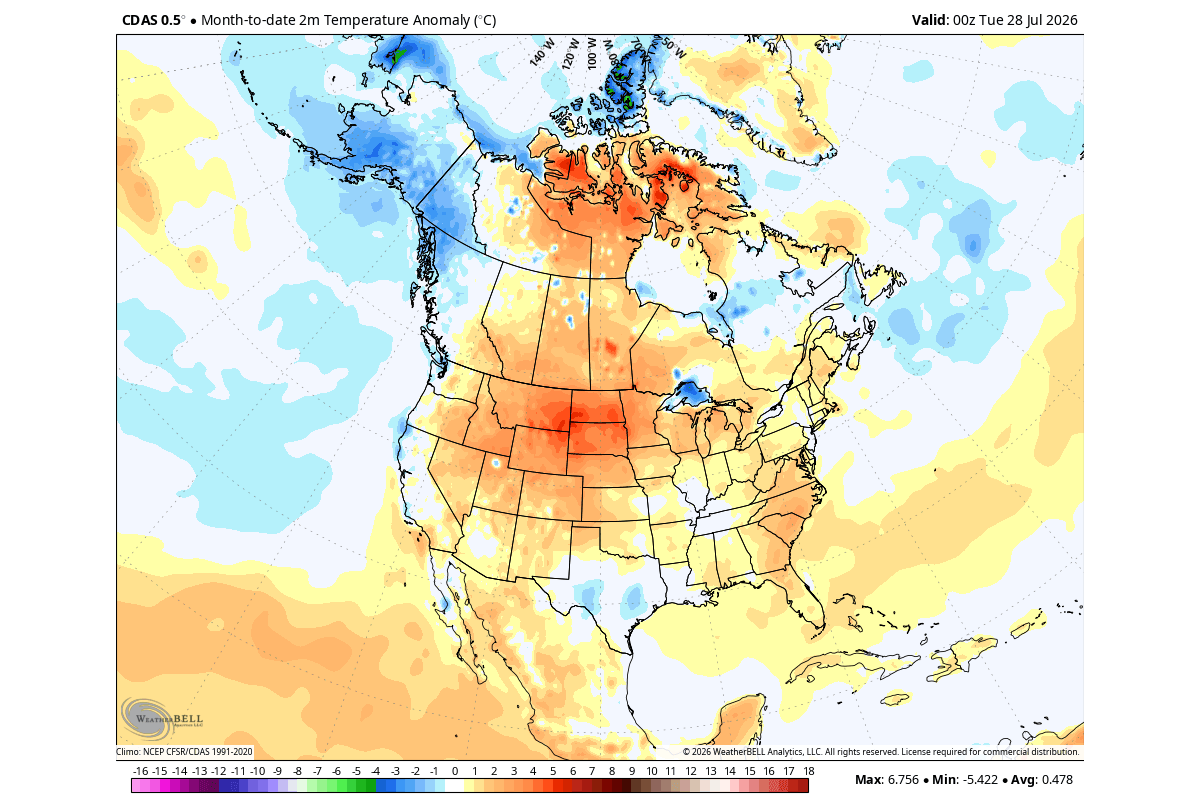
This comes from the pressure pattern, which in a rising Super El Niño July favors low-pressure area development over the west-central United States. That allows a more southerly flow to develop, bringing higher temperatures than normal into central, northern, and eastern parts of the United States and Canada.
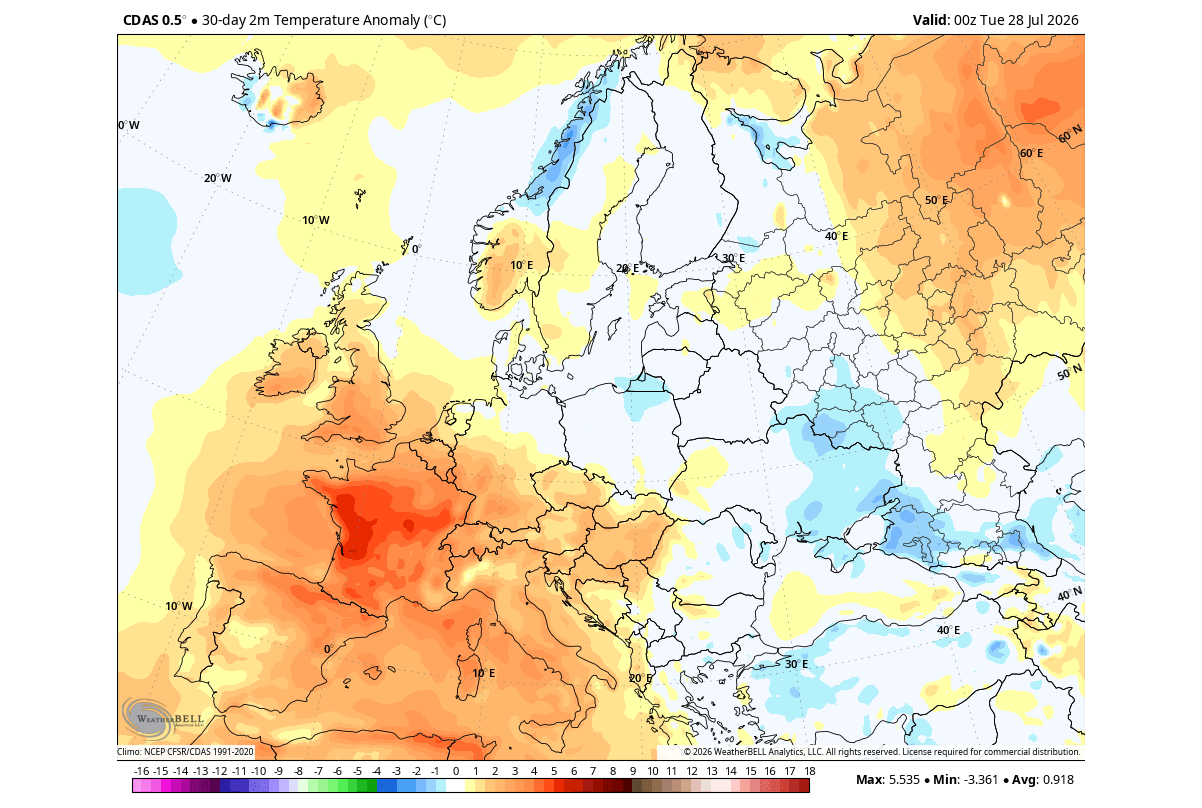
Over Europe, we can also see the temperature anomaly as expected from the past Super El Niño analysis above. July featured a significant warm anomaly over the western half of the continent, while normal to below normal temperatures covered areas to the northeast and east.
But the clearest atmospheric signature of the new El Niño is detected using the Velocity Potential forecast at the 200mb level (12km/7.5miles altitude). This shows us areas of rising and sinking air, revealing the broad atmospheric circulation, and the earlier-mentioned atmospheric bridge that develops in an El Niño.
Below is the GDAS analysis for July, which already shows an immense atmospheric bridge anomaly, with strong rising air motion in the central and eastern Pacific area (teal colors). A strong sinking motion was detected in the Indian Ocean area (brown colors), showing a highly modified Walker cell and a clear El Niño-related atmospheric signal.
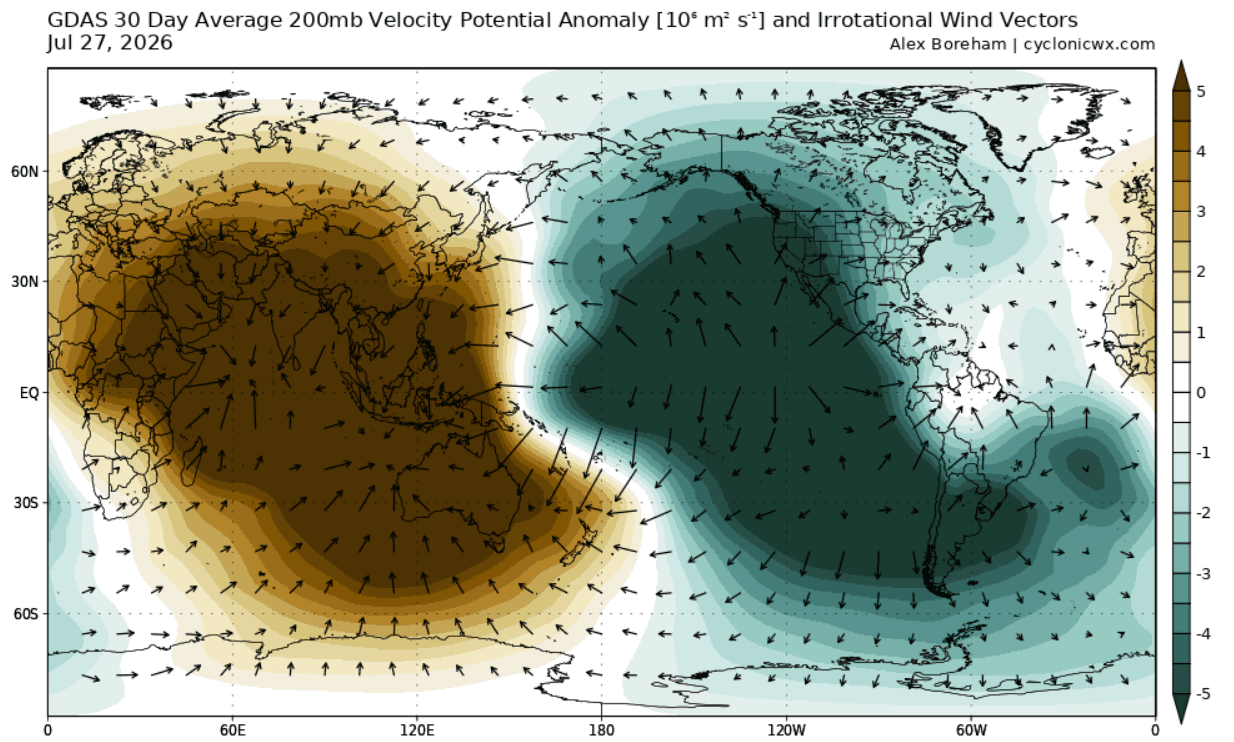
Overall, this confirms that we are on a proper Super El Niño path for 2026/2027 impacts, expected to only grow stronger as we go into late Summer, and then into boreal Fall and Winter.
August Forecast: Pacific Standing Wave Locking Down the Atmosphere
Going into August, we can first look at the ECMWF ensemble forecast trend for atmospheric motion, the same as above, but for the next few weeks. You can see a large persistent area of rising air over the central and eastern Pacific, and an area of sinking air over the Indian Ocean, a typical Super El Niño atmospheric circulation.
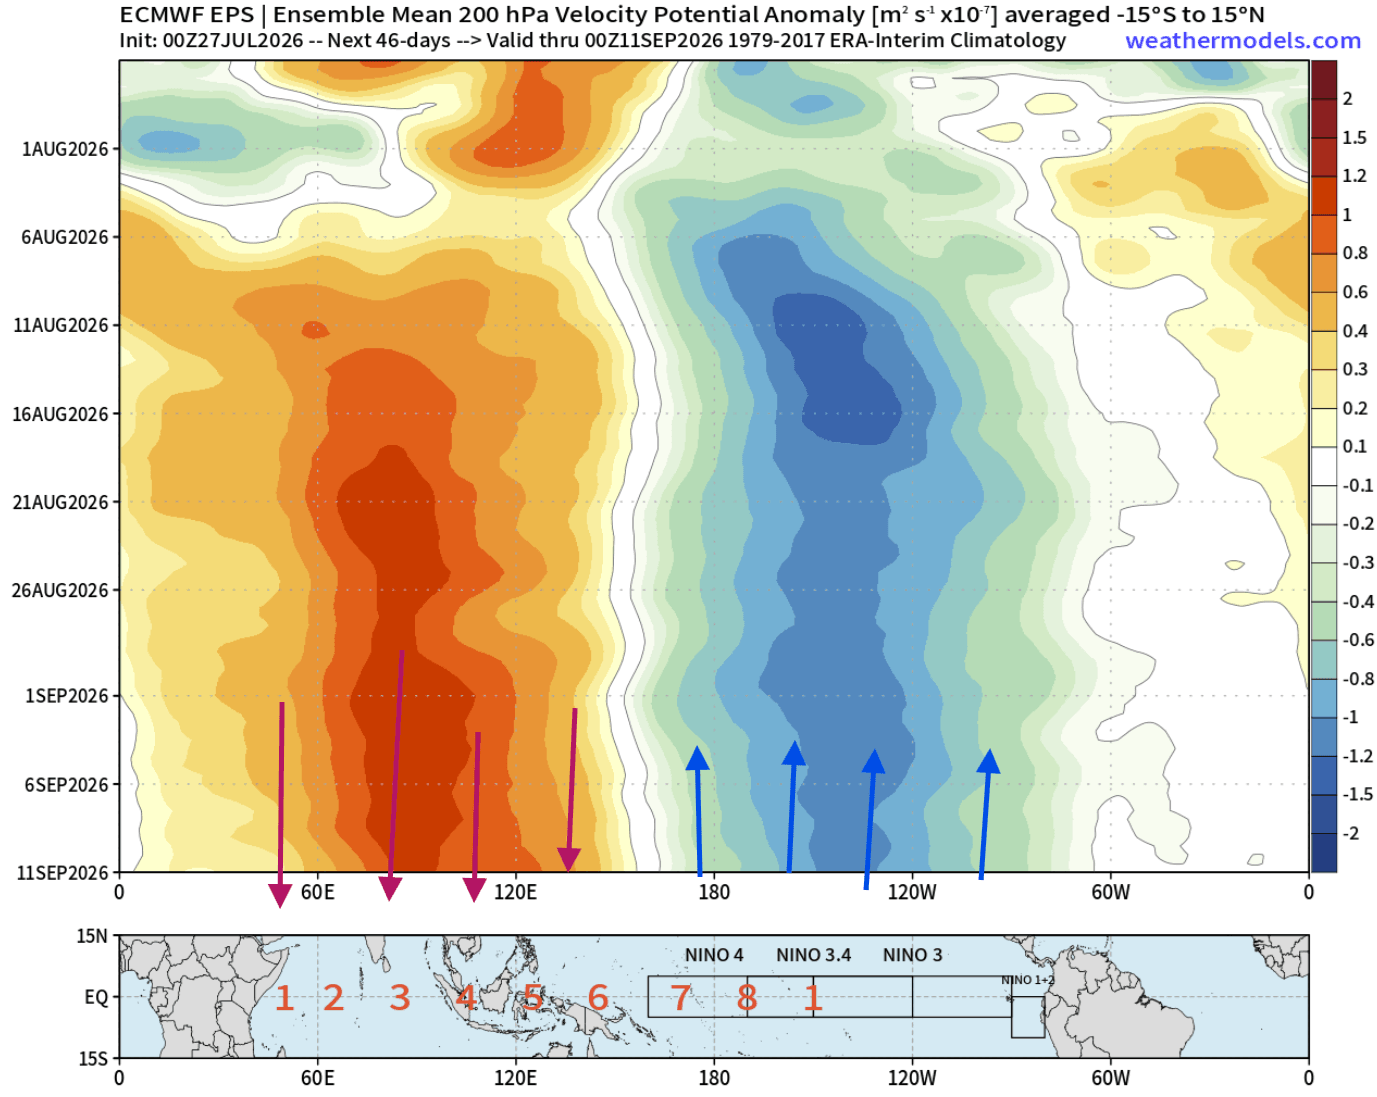
You can see, based on the static look, that this will be forced and locked in place by the unusually strong El Niño anomaly in the Pacific area. This is what scientists call an atmospheric standing wave. An almost fixed/stationary area of rising air and low pressure over the tropical Pacific and the ENSO region, forced by a Super El Niño event.
This means that the atmospheric response is expected to strengthen from these changes, including August, and then especially in Fall and Winter.
Below is the August pressure pattern signal from past El Niño years based on NOAA PSL data, and it shows a change in flow compared to July. The main low-pressure area over North America is trending farther east. This allows a ridge to build over the west-central United States and Canada, driving higher temperatures.
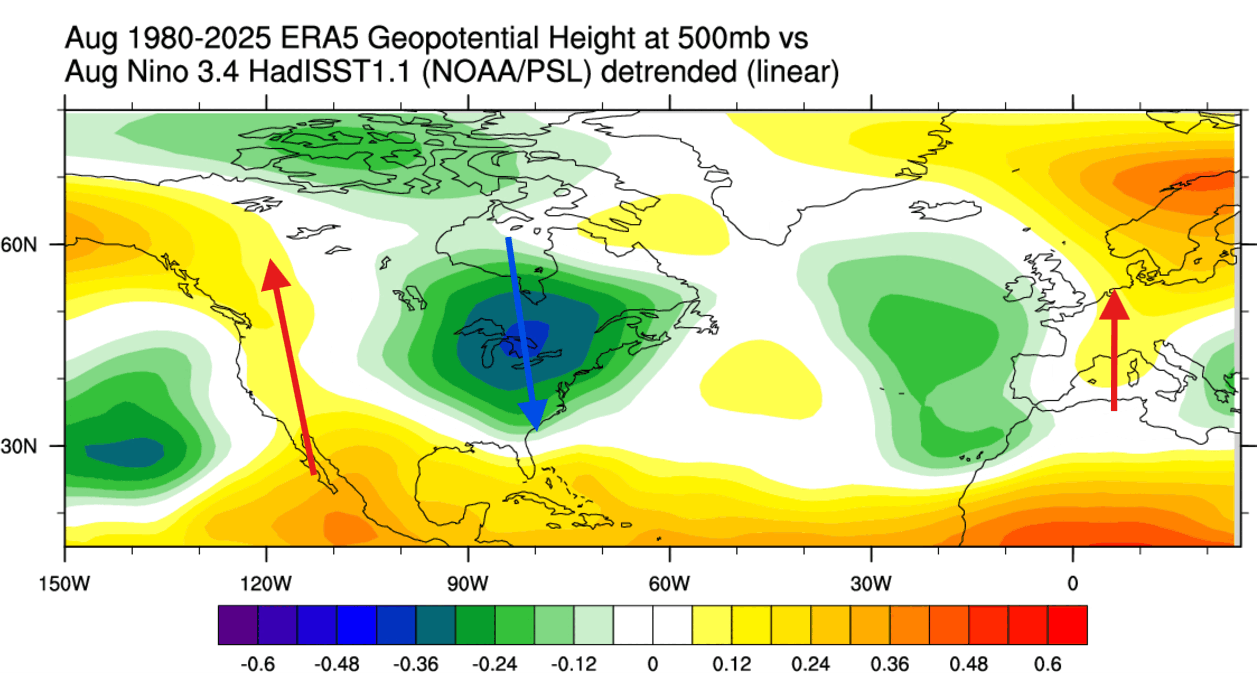
A strong high-pressure blocking anomaly is visible over far northern Europe, with a low-pressure area in the northern Atlantic region.
Looking ahead into the first third of August, you can see the pressure pattern forecast below. It shows a ridge anomaly over the west-central United States. But you can see a low-pressure area tendency over southern Canada and into the eastern United States. This can bring a reversed flow over the U.S. versus Canada.
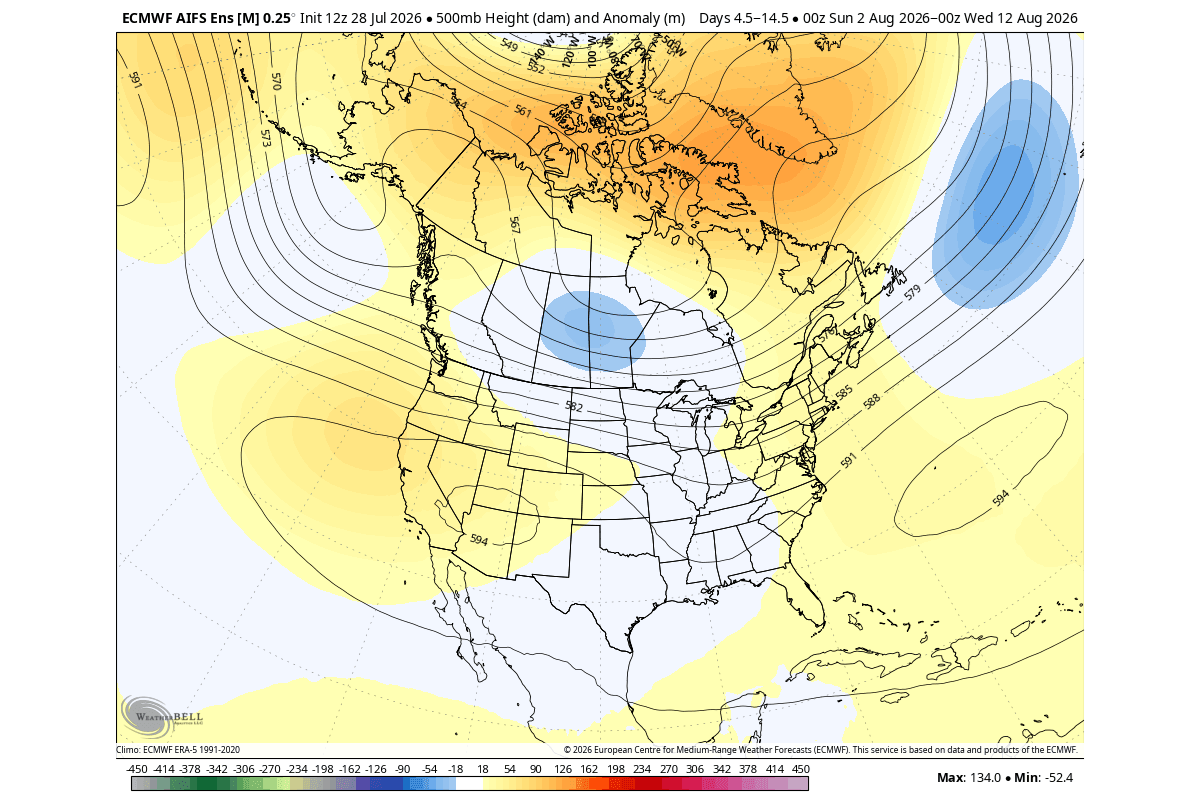
This perhaps doesn’t look like the past August analysis above. But of course, each event has its own details and nuances, and we are currently looking at just the early month, while the analysis of past El Niño events above is a full-month anomaly.
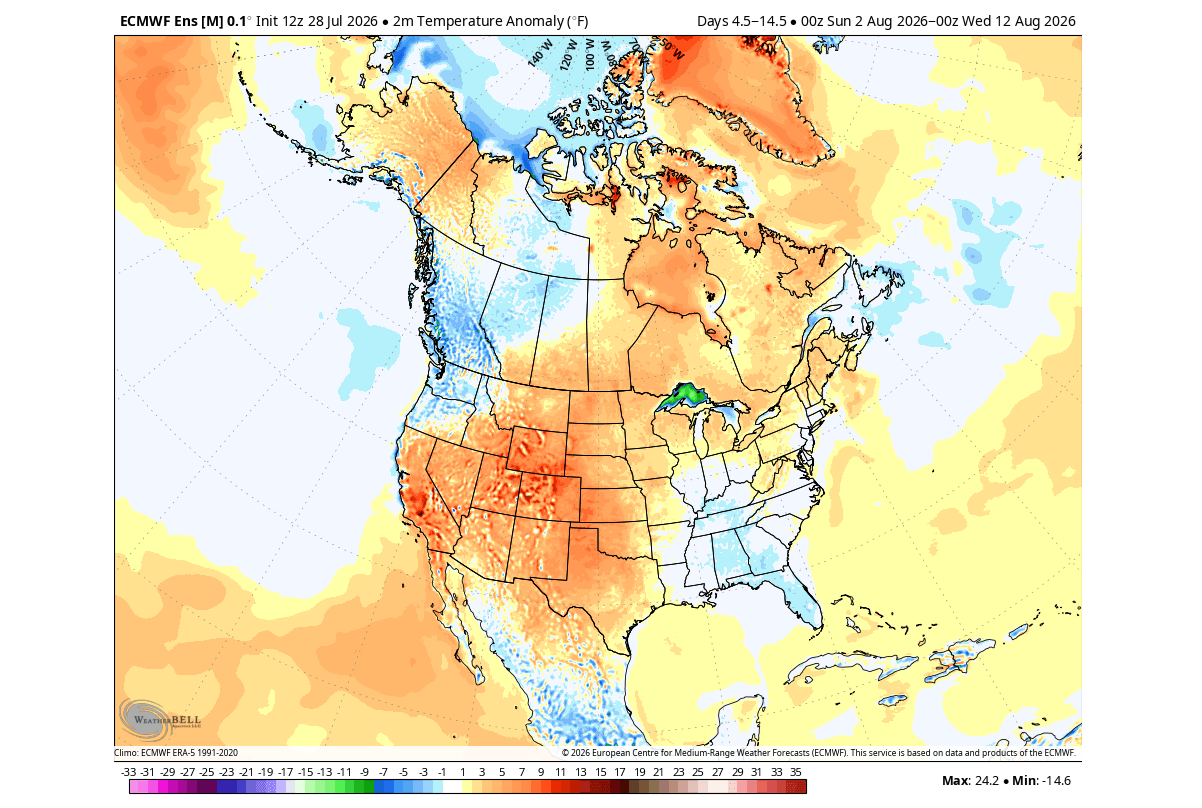
The surface temperature pattern for this period is more revealing. You can see a warm anomaly over the central and western parts of the United States, and normal to below-normal temperatures in the east. Over Canada, the pattern is reversed, with warmer temperatures in the east-central parts and lower over the west.
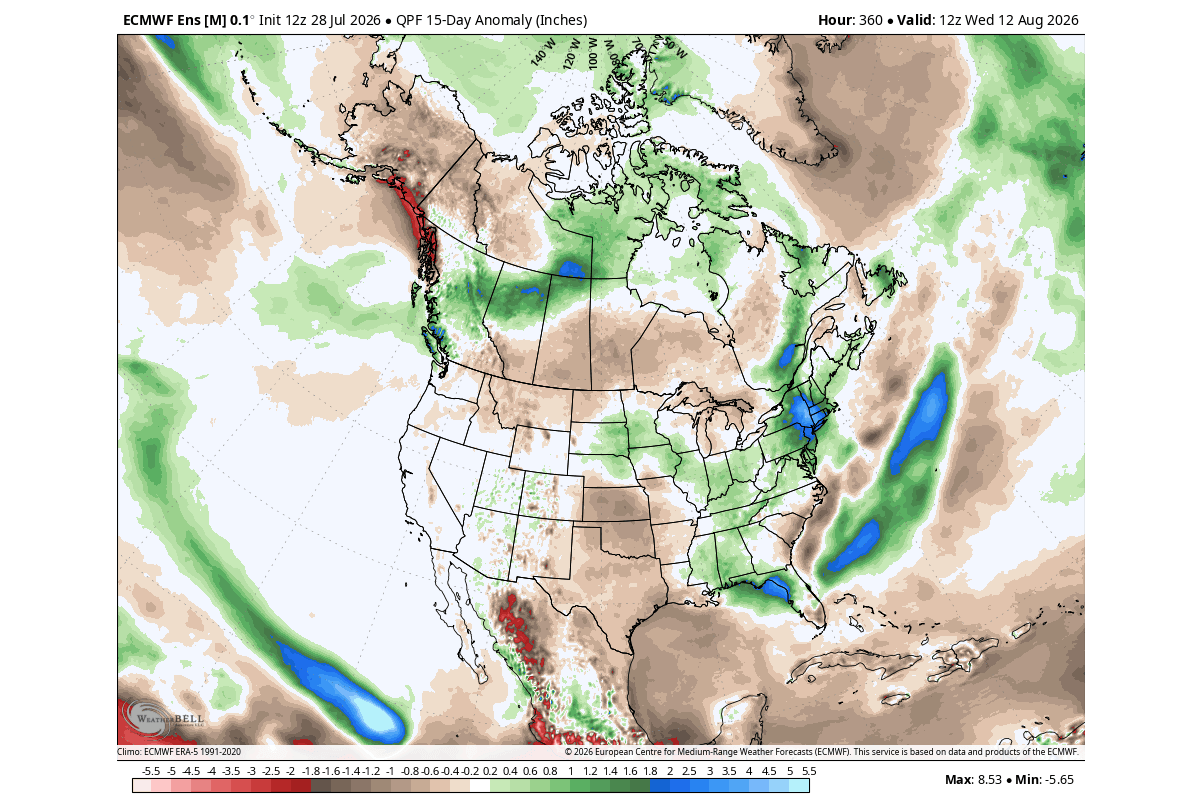
The precipitation anomaly forecast also shows more rainfall over the eastern and northeastern parts of the United States, under the impact of lower pressure. Less rainfall than normal is expected over the northern and south-central parts of the U.S. and over southern Canada.
But the story changes quickly as we get closer to mid-month, with the latest trends going for a low-pressure anomaly over the eastern United States, exactly as past data indicated for El Niño August. Below is a single operational run example of the idea, which shows a possible development scenario.
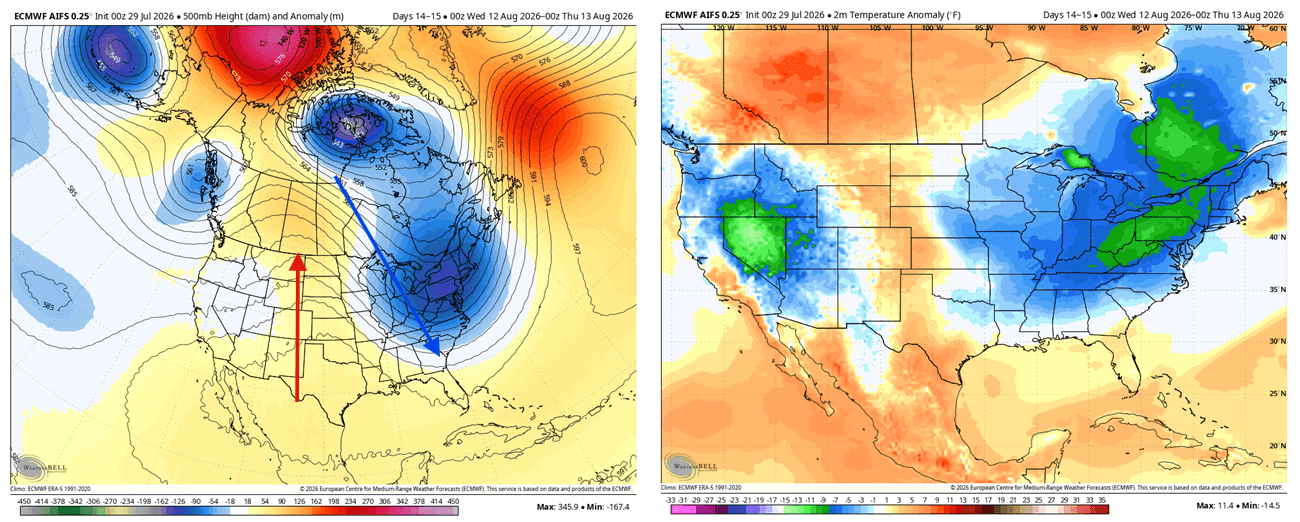
The pressure anomaly (left) is close to a scenario from past analysis. On the right, we have the temperature anomaly, revealing well below-normal temperatures driven into the eastern and central United States and southeastern Canada.
This is only a single-run forecast, but it serves as a great example of what the tendency is in the latest data, as August goes into full El Niño mode, supported by extended ensemble predictions.
Mid-to-Late August Outlook: Troughing Shift to the Eastern United States
Below is the latest extended ensemble forecast trend for mid-to-late August. It shows a pressure setup trending more towards a proper El Niño pattern: A low-pressure tendency over the eastern United States and Canada, and a ridge in the west-central parts. That usually brings a normal to below-normal temperature trend to the eastern U.S. and Canada, with higher temperatures towards the west.
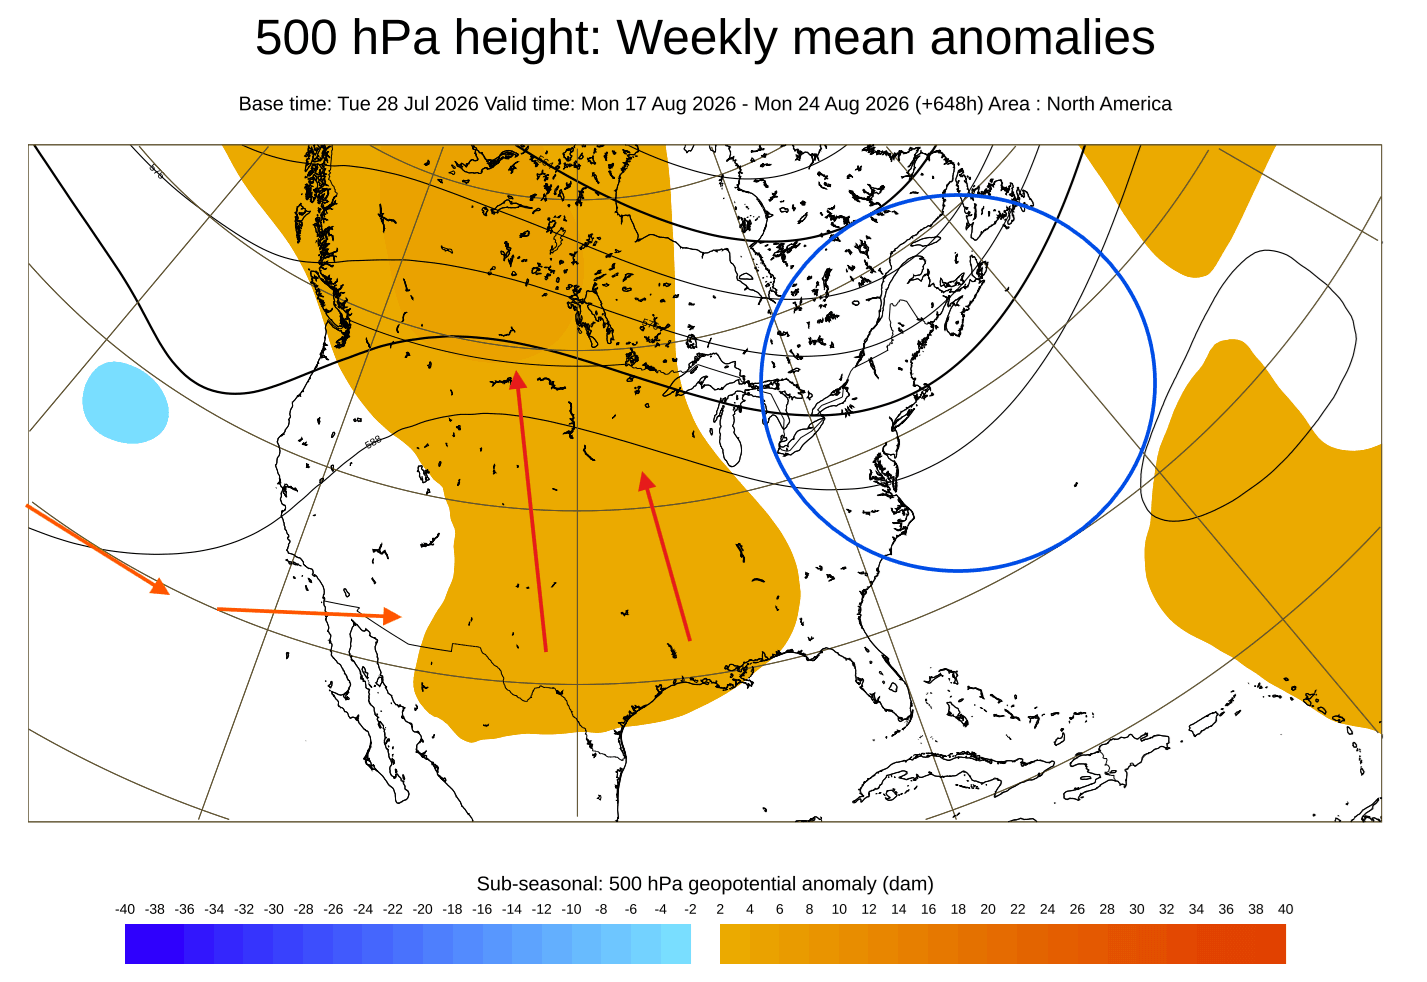
You can already see the low-pressure area developing in the Pacific, amplifying the subtropical jet stream (orange arrows), helping to boost the United States ridge. This low-pressure area and the jet stream will further strengthen over Fall, creating a stronger Pacific jet stream across the southern United States by Winter.
The temperature trends for mid-August (left) also show a pattern similar to that of the historical data. A normal to below-normal temperature pattern covers eastern Canada, expanding into parts of the Midwest and the eastern United States on a northerly flow. The core warmth stays over the south-central and northern U.S. and southern Canada.
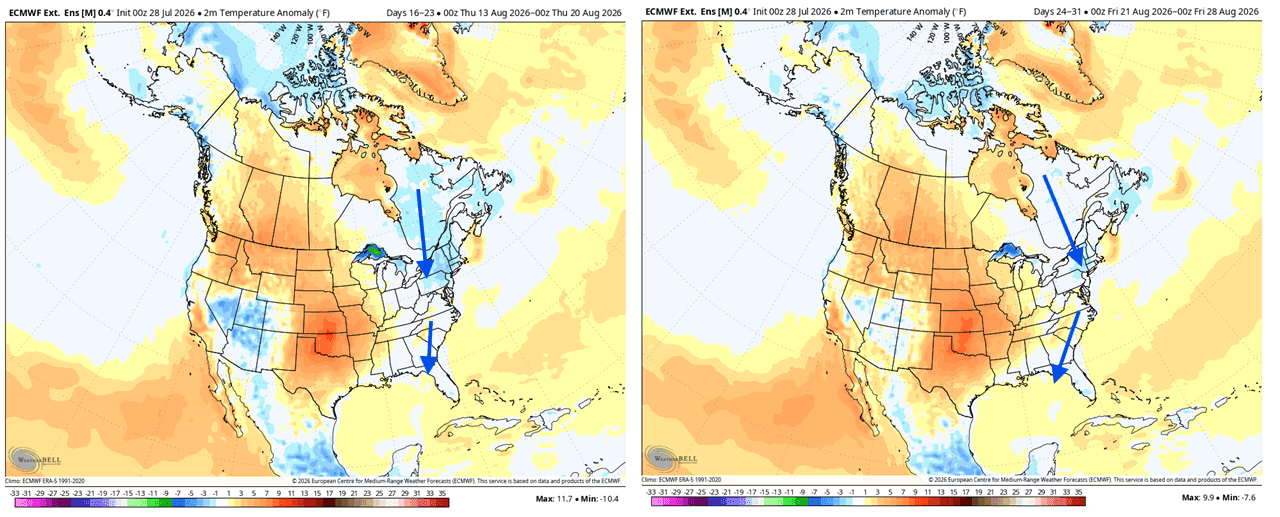
For late August (right), the latest trends show warm temperature anomalies staying in place, with the continued milder flow over the eastern parts of the U.S. and southeastern Canada.
The rainfall forecast for this period shows below-normal rainfall trend across the south-central United States, the upper Midwest, the Pacific Northwest, and Florida. More rainfall is forecast over the western and northeastern U.S. and over southeast Canada.
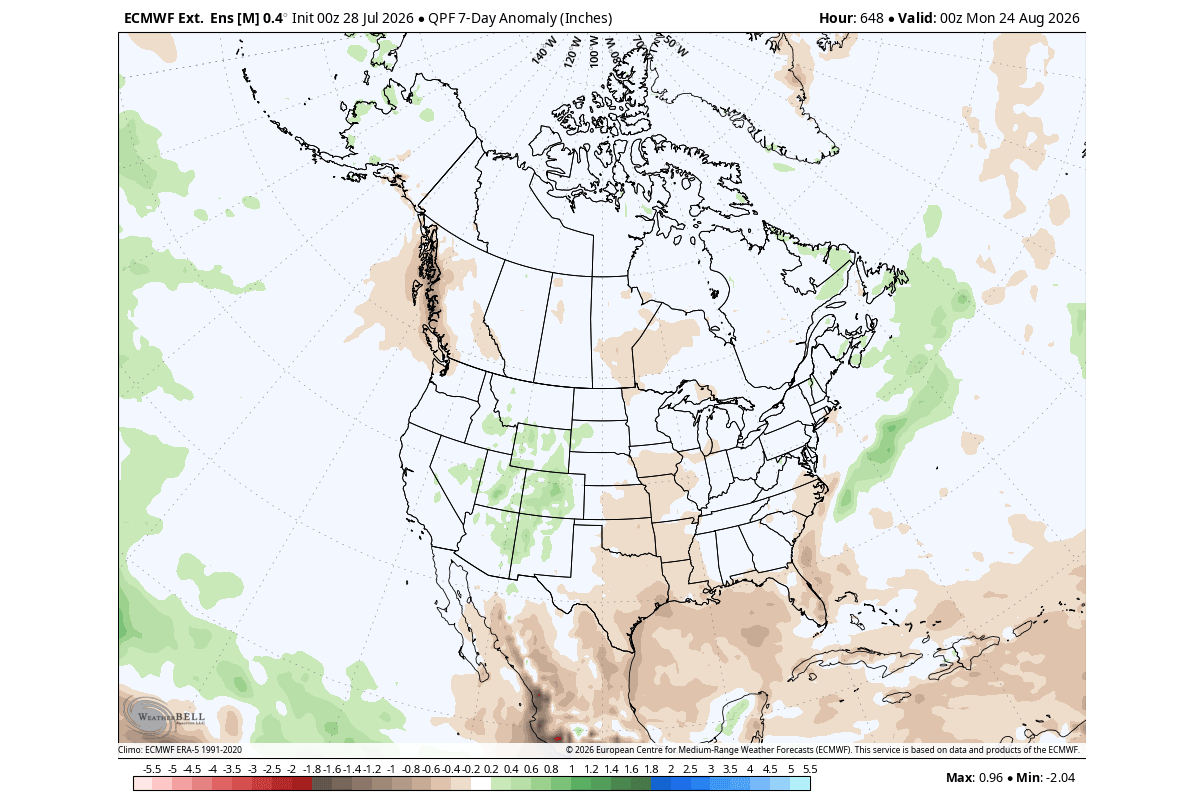
This is overall consistent with an August El Niño signal, in this case amplified by the atmospheric standing wave in the Pacific. But before we look at further amplification in Fall and Winter, we will quickly look at the August weather trends across Europe.
Europe Pattern: Low-Pressure Zone Resists Early El Niño Forcing
Looking also at Europe, the first third of the month doesn’t feature the typical blocking high over the north as indicated, and instead shows a low-pressure anomaly. A high-pressure area is forecast over the central, southern, and southeastern parts.
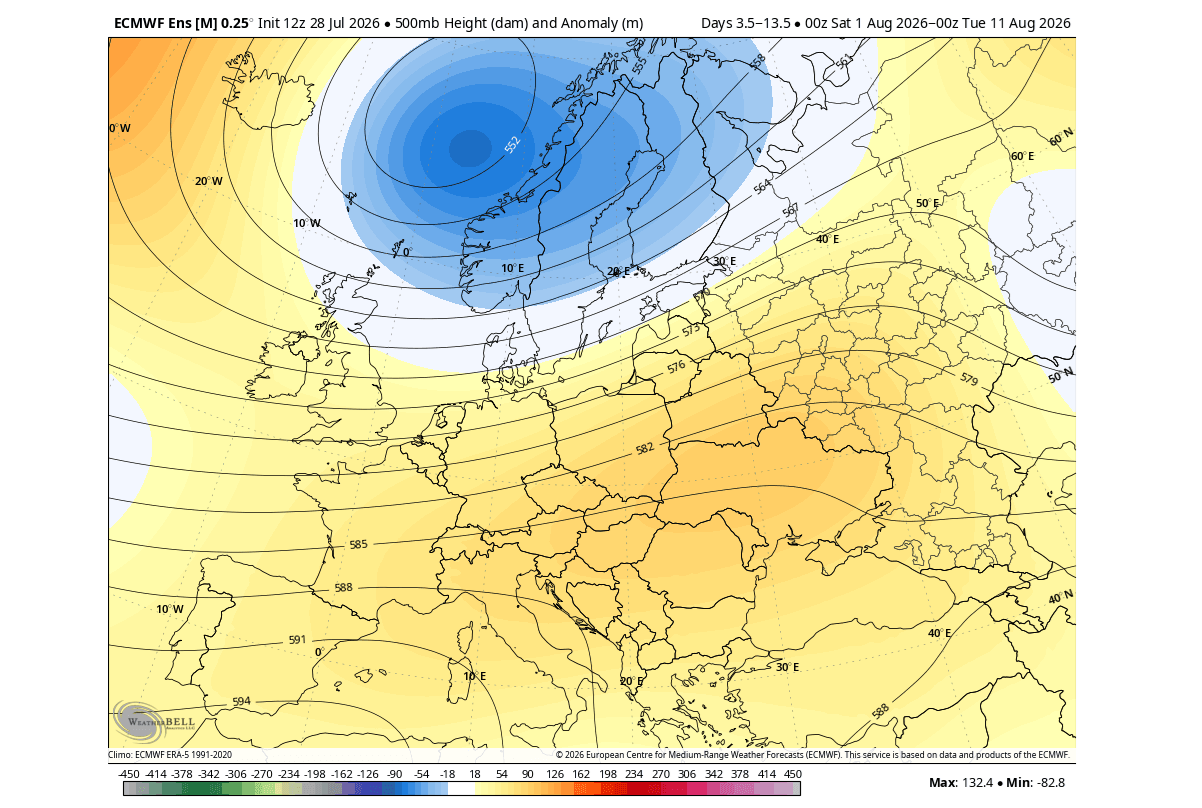
The temperature and precipitation forecast for this period shows the high-pressure impact, with above-normal warmth and dry conditions over most of the continent. Normal to below-normal temperatures are forecast over the north and northwest, along with more rainfall, driven by the low-pressure anomaly.
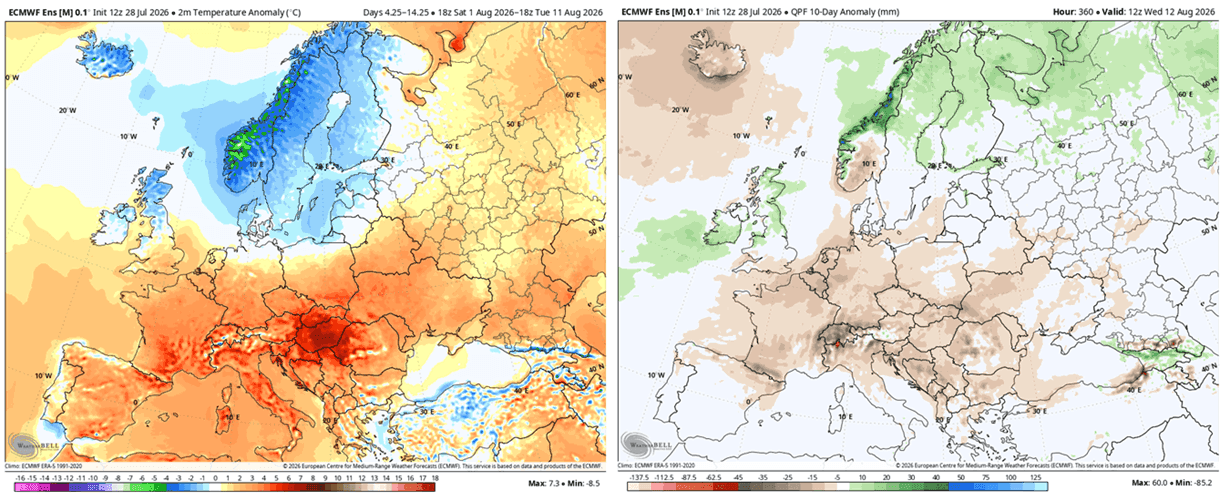
The situation changes a bit as we go into the second half of August. Below is the pressure and temperature forecast, which shows the high-pressure area moving farther east. That allows the low-pressure area to drop a bit farther to the south into the west-central parts.
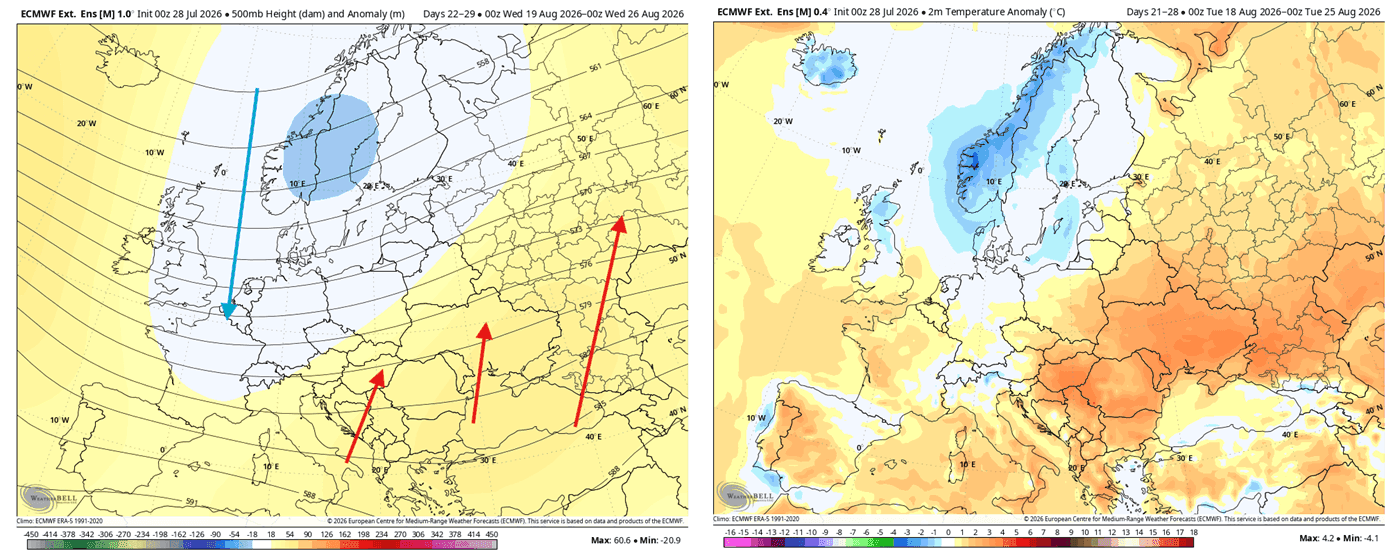
This impacts the temperature anomalies, allowing the return to more normal conditions over the western and central parts, while the north stays in below-normal temperatures. The trend is for the peak heat dome to shift further east with the ridge.
As mentioned before, Europe is far from a direct El Niño impact, which can vary here before Fall or Winter, when it finally reaches its peak strength. But as seasons change, the influence is expected to extend across much of the global atmosphere.
El Niño Mechanics: How Extreme Events Reshape the Jet Stream
Not all El Niño events trigger global weather changes in the exact same way, as there are different factors that go into their impacts. For example, the location of the main ocean warm anomaly plays a massive role, as well as its strength.
The diagram below from a recent study (linked down below) shows the Fall atmospheric engine behind two distinct types of El Niño: Central Pacific (CP) and Eastern Pacific (EP). By changing where tropical heat and lower pressure are focused, the warm center of El Niño can fundamentally change how energy is pumped into the atmosphere and sent downstream toward North America.
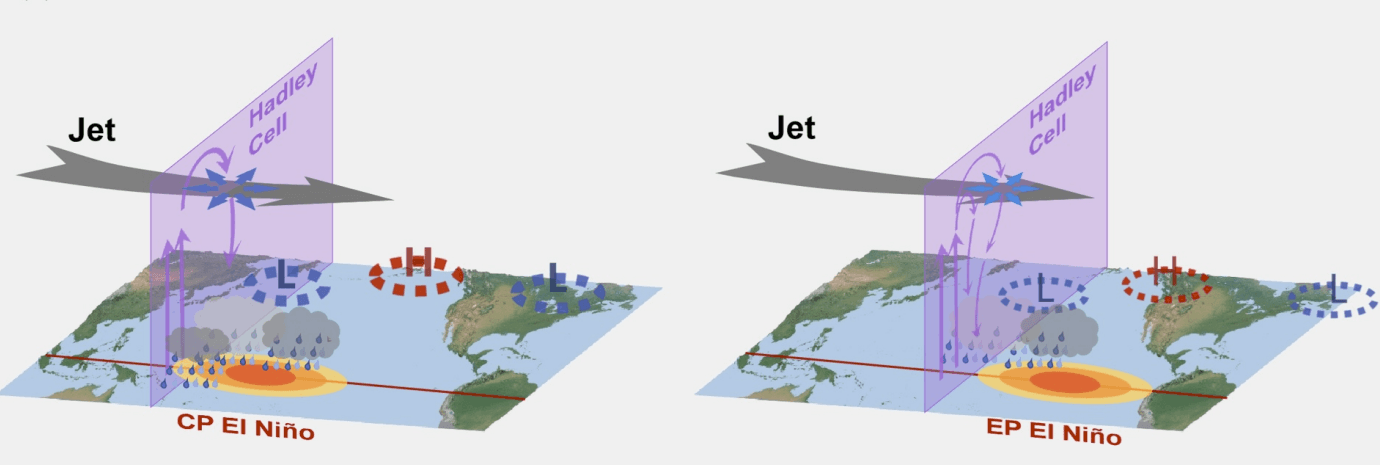
This image shows Fall conditions, and the location of peak ocean warming determines how effectively El Niño can “bend” the jet stream. Central Pacific warming acts like a more direct hit on the atmospheric flow, creating a strong wave pattern that reshapes North American winter weather.
When heat is confined farther east, the tropical setup interacts less efficiently with upper-level winds at this stage, producing a slightly weaker ripple effect across the Northern Hemisphere. This can explain the slower late Summer weather response over Europe, forecast above.
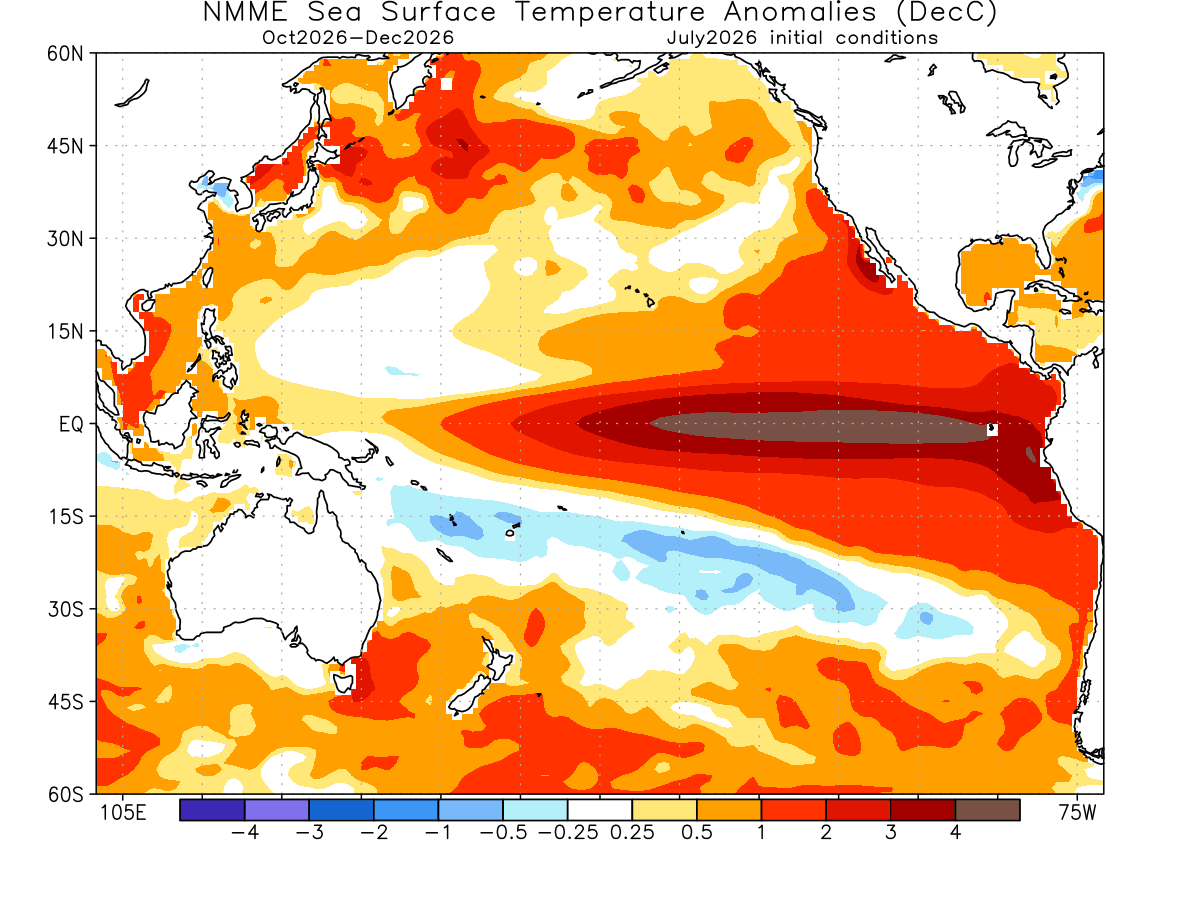
We can determine the type of the 2026 event on the latest NMME forecast for the October-December period. It shows a significant El Niño anomaly across the tropical and northern Pacific, classified as an Eastern Pacific (EP) event. But the anomaly peak across the main ENSO region is above +4 degrees, making this an extreme level event.
When an El Niño intensifies to extreme levels, its influence reaches high into the atmosphere, substantially influencing winter pressure patterns across the Pacific and North America. The image below is from a study (linked below) that compared 500mb anomalies (5km/3.1miles) during Winter for moderate and strong events. While a moderate event produces a mild wave pattern, an Extreme El Niño triggers a far more aggressive shift in the jet stream.
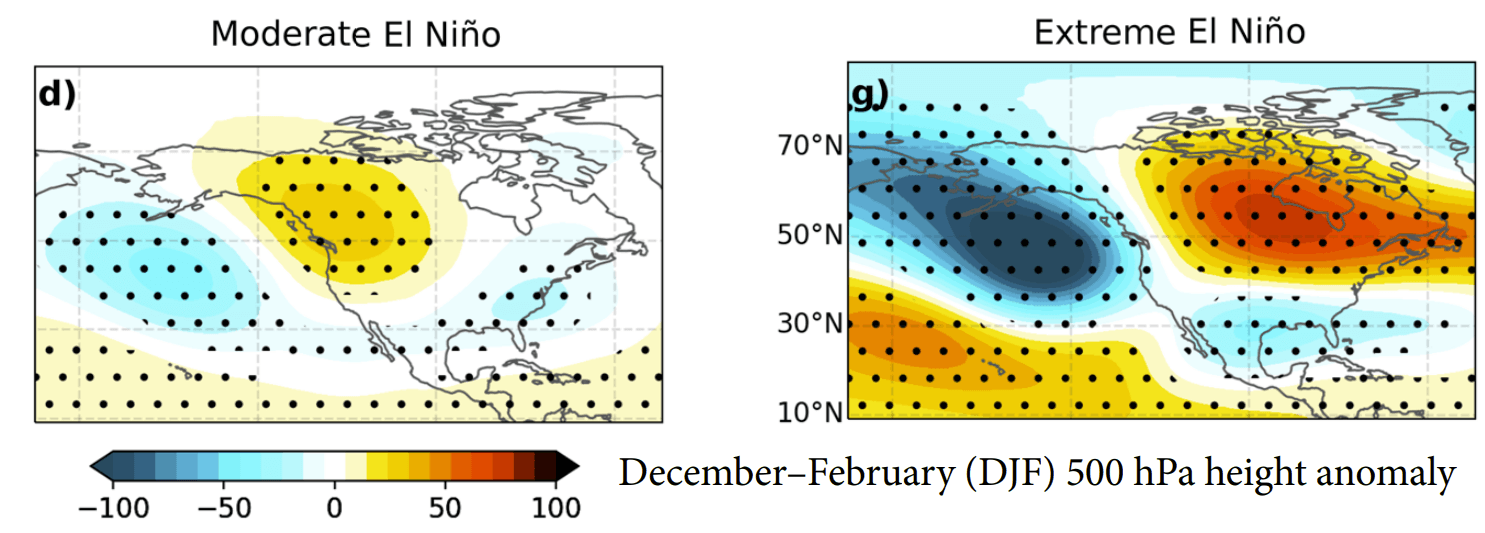
In short, the transition from a Moderate to an Extreme El Niño leads to a strong amplification of upper-level weather patterns. The deeper Pacific trough and powerful Canadian ridge form an atmospheric highway. This setup locks mild weather in the north while driving an active storm track across the southern United States.
This clear difference explains why “Super” El Niño winters deliver far more distinct temperature and precipitation anomalies than typical events. So, despite this year being an EP event, the raw strength of the El Niño ultimately drives the winter pattern.
Below is the pressure pattern forecast for Fall, and it looks unusually evolved, similar to a moderate El Niño Winter response. It looks ahead of time in Fall already, due to the strength of the El Niño event. You can see a high-pressure anomaly over Canada, with the El Niño Pacific low, and a low-pressure zone over the southern United States into the Atlantic.
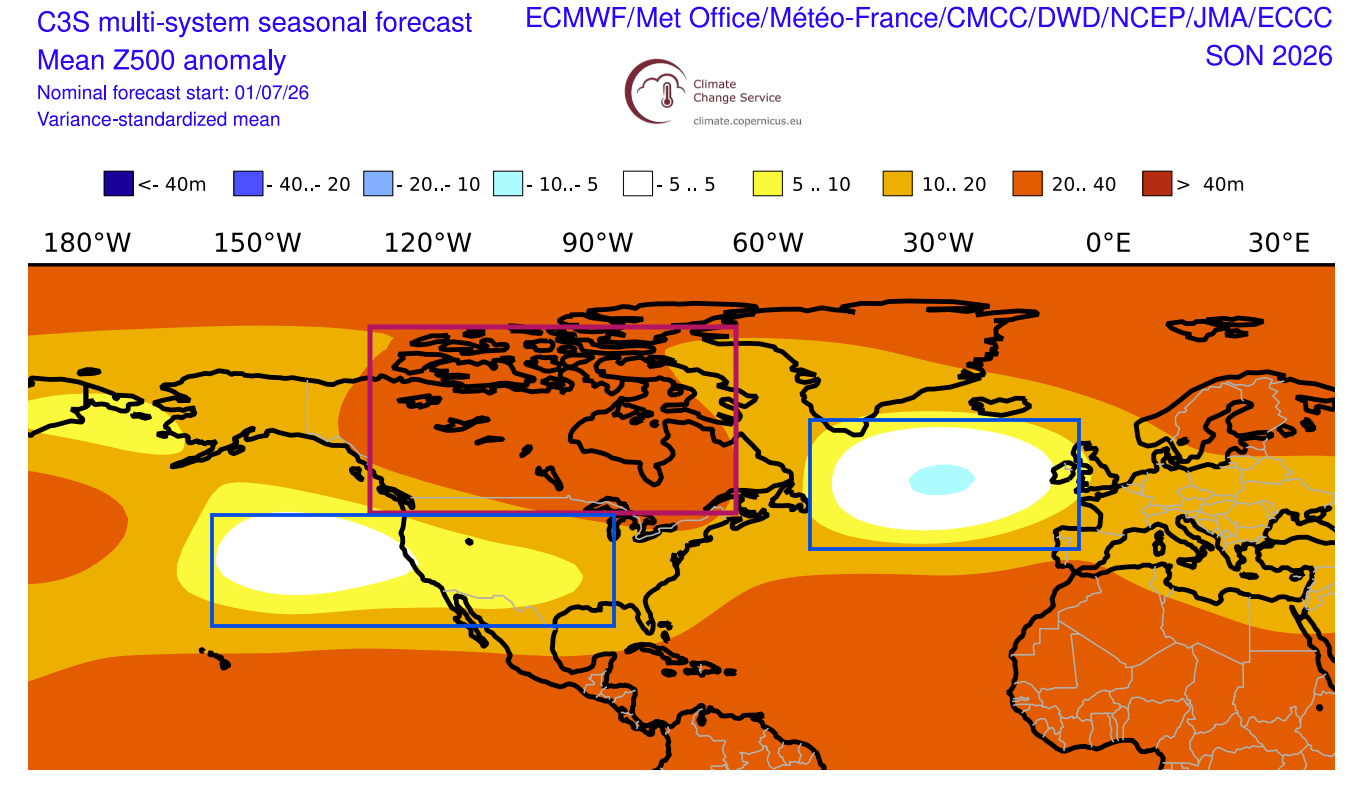
The Atlantic low-pressure zone is also reaching into the UK and Ireland. This promotes a westerly flow over the continent and a warmer southerly airmass rising towards the north.
Overall, this is an interesting development that really highlights just how strong the global forcing is already, clearly visible also in the Fall and Winter weather pattern trends.
Fall 2026 Forecast: Amplified Pacific Jet Stream Drives Weather Patterns
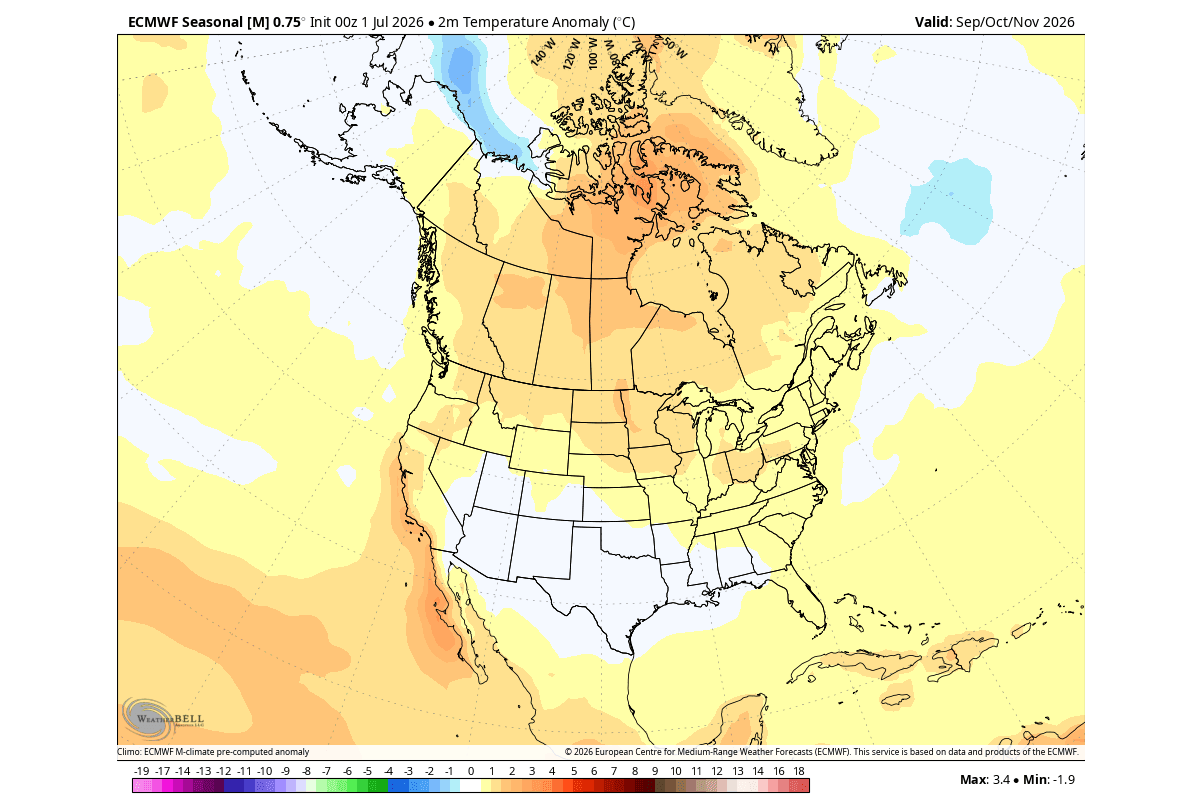
The final “touchdown” of the El Niño is ultimately seen in our daily weather, in the form of pressure, temperature, and precipitation changes. Below are the latest Fall forecast trends, which really show the El Niño pattern amplifying.
Starting with North America, we see the core of warmer temperatures under the high-pressure area over the northern half of the United States and over Canada. Due to a more persistent low-pressure storm track starting to establish in the southern half of the United States, the temperatures are forecast to remain around normal.
Looking at precipitation, you can see a well-developed El Niño signature, with increased rainfall over most of the United States, especially in the south, due to the amplified Pacific jet stream. A stronger Pacific jet brings more moisture and low-pressure systems, creating more precipitation and unsettled weather.
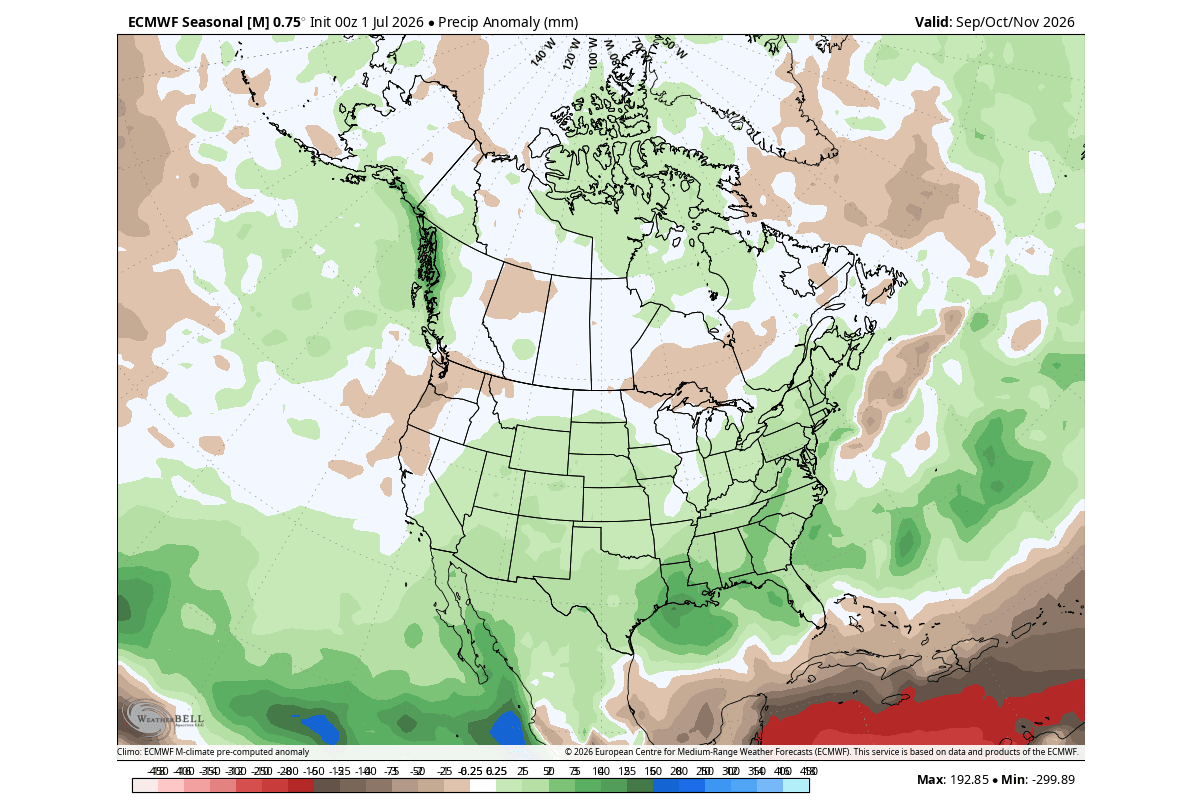
We can see areas with below-normal Fall rainfall in the northwestern United States, the upper Midwest, and over southern, western, and northeastern Canada.
Over Europe, we can see warmer-than-normal surface temperatures over much of the continent. Warmer anomalies are focused on the central and western regions, driven by the westerly and southwesterly flow, with a warmer airmass coming from the south.
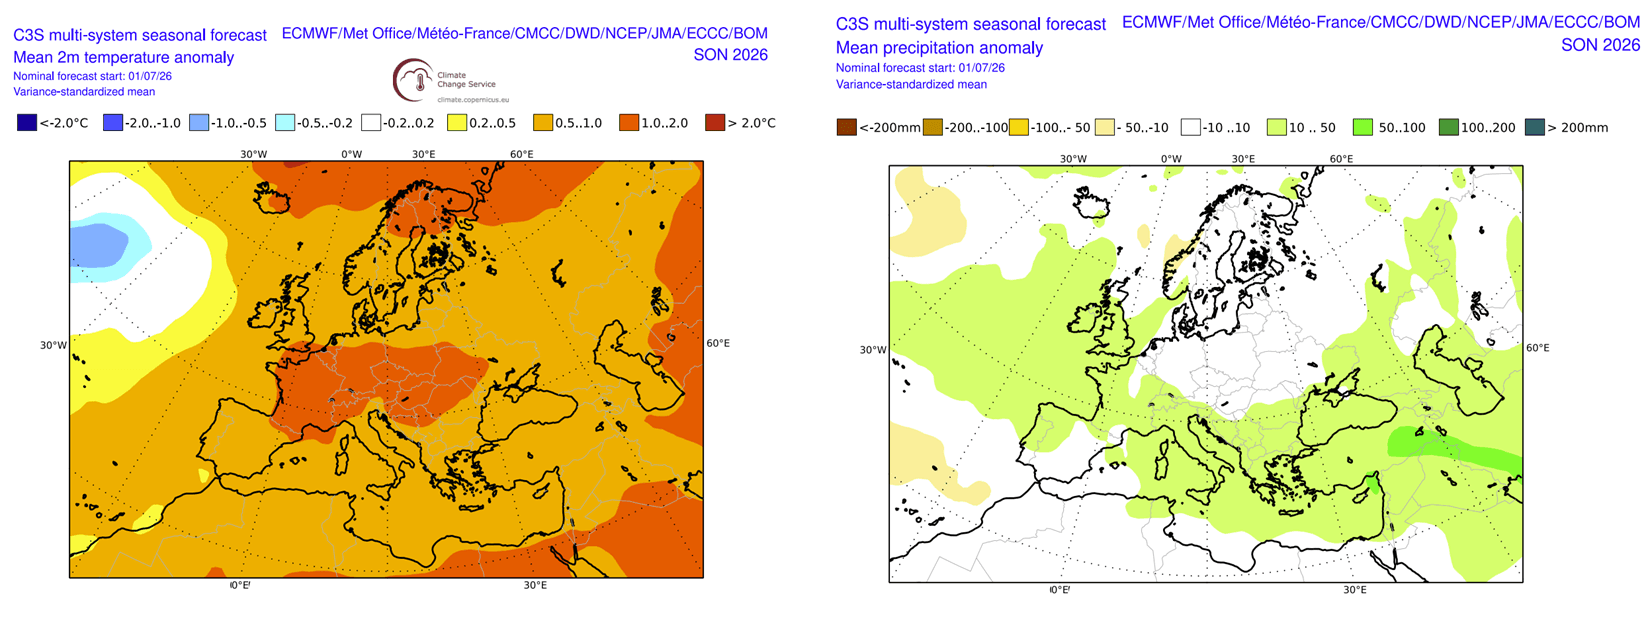
The multi-model forecast also shows above-normal Autumn rainfall across much of the continent apart from the north. This is the result of a more westerly flow from the Atlantic low-pressure area, bringing in a lot of moisture, increasing precipitation potential from the northwest to the central and southern areas.
These forecasts suggest the high El Niño anomaly is creating a faster evolution of the pattern, further amplifying it toward winter.
Winter 2026/2027 Outlook: Split-Flow Pattern and Cold Air Intrusions
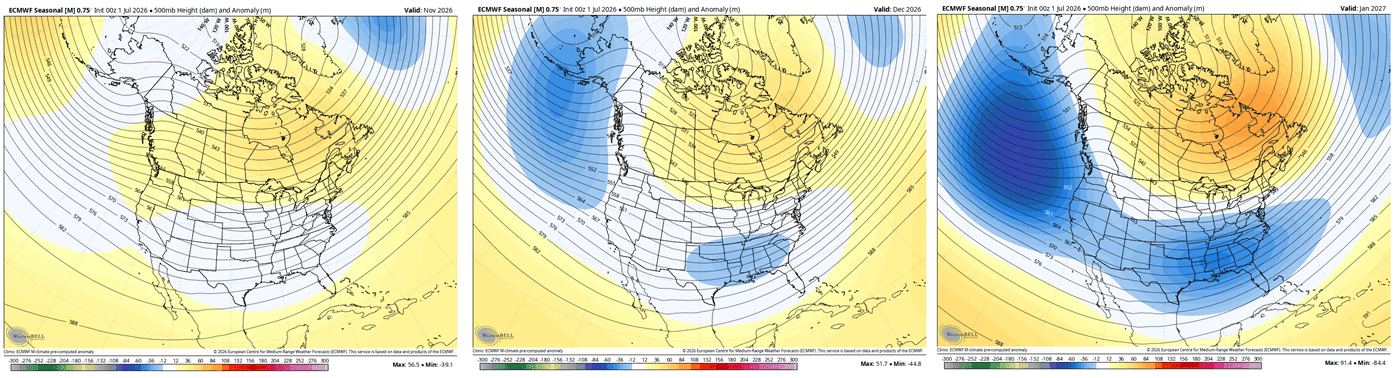
The image below shows the direct comparison between the November, December, and January ECMWF forecasts (from left to right). You can see a significant change in the strength of the anomalies in the otherwise stable pressure pattern. We can see a signature strong El Niño winter signal, but already developed in mid-to-late Fall.
Looking ahead to the winter season as a whole, NOAA’s next-generation SFS model projects a distinct split-flow atmospheric pattern across North America. This setup powers the main jet stream energy across the southern half of the United States while holding higher pressure to the north.
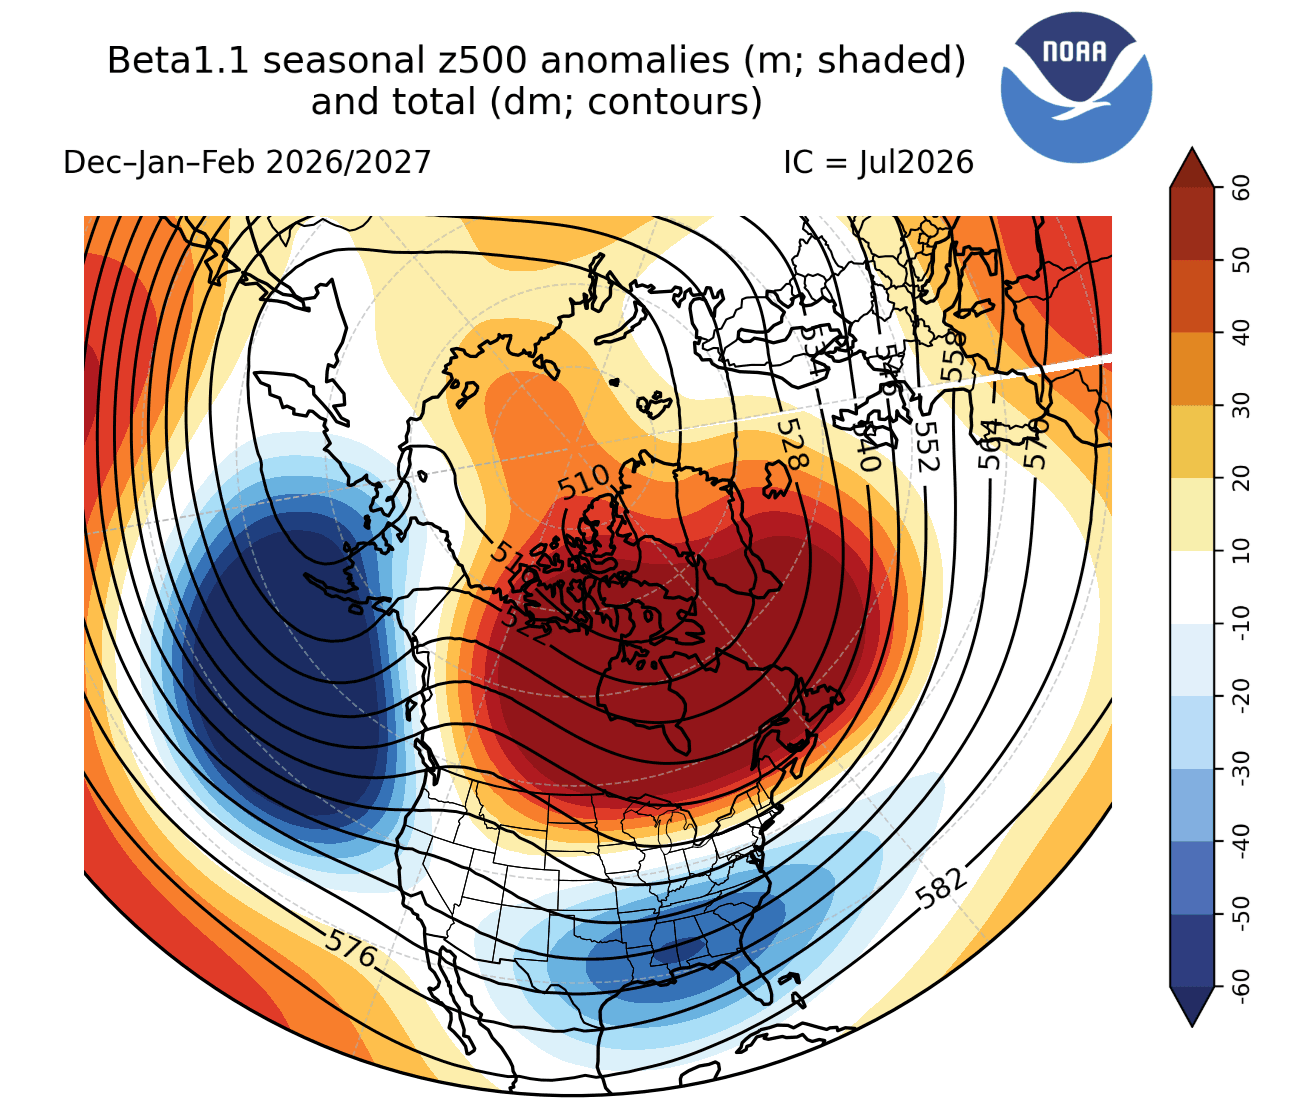
A strong high-pressure block over Canada is projected to suppress deep Arctic air. This reduces seasonal snowfall potential across the Northern Plains, upper Midwest, and Great Lakes. The active storm track is displaced southward, shifting winter storm and snowfall opportunities into the Central and Southern Plains and parts of the interior Mid-Atlantic.
The surface temperature anomaly forecast for January and February directly reflects this impact of the stronger southern jet stream setup. You can see how temperature patterns are projected to evolve across North America as the El Niño influence reaches its mid-to-late winter peak, with a spreading anomaly of below-normal temperatures.
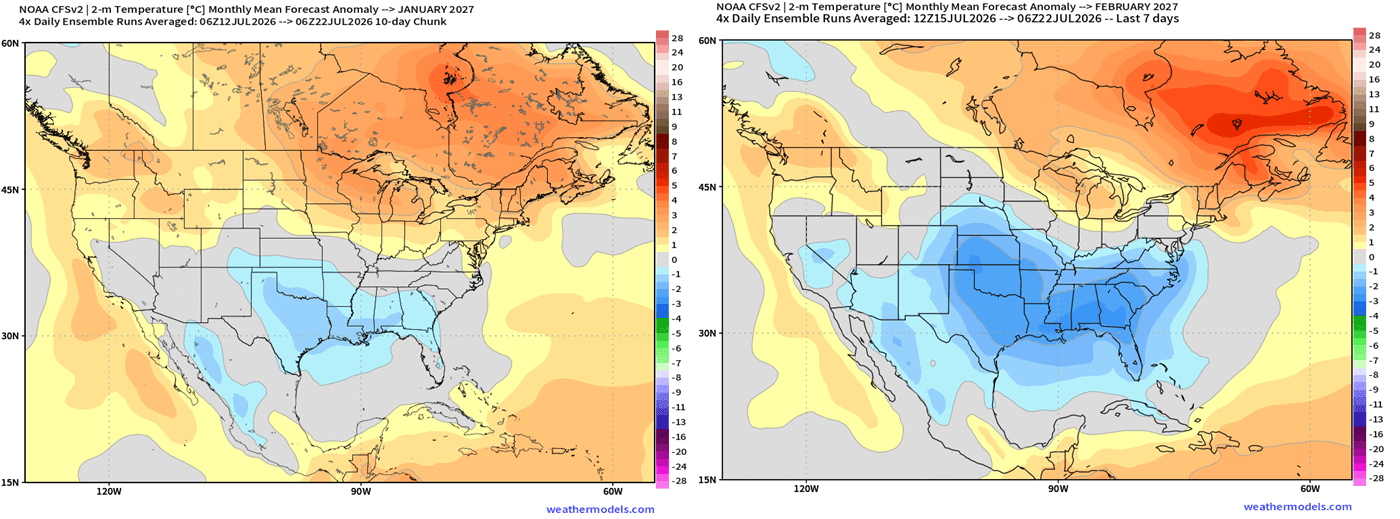
In January (left), a distinct cooling footprint establishes itself across the Southern Plains and Gulf Coast, contrasted by strong warm anomalies across Canada. By February (right), this cooling anomaly deepens and expands. A broad area of below-normal temperatures covers the Central, Southern, and Eastern United States as cold air intrusions become more frequent.
We will monitor the developing situation weekly, with fresh forecast data available in less than 10 days, giving a new, clear view of the seasonal weather development across the United States, Canada, and Europe.
Scientific Studies Used in this Article
Forecast and analysis images in this article are from ECMWF, CyclonicWX, weathermodels.com, and WeatherBell (using a commercial license).
Full Fall 2026 forecast: Fall 2026 Forecast: Super El Niño Sets Up a Winter-Like Weather Pattern That Strengthens Into January
El Niño development in-depth analysis: Super El Niño Forecast Pushes Toward Record Strength as Winter 2026/2027 Signals Emerge
We will keep you updated on the global weather pattern development, so bookmark our page. Also, if you have seen this article in the Google App (Discover) feed, click the like (♥) or the star button there to see more of our forecasts and our latest articles on weather and nature in general.